7

I'd like to plot several data into a grid using holoviews/hvplot, based on one dimension, which contains several unique data points.

Considering this example:

import seaborn as sns
import hvplot.pandas

iris = sns.load_dataset('iris')
plot = iris.hvplot.scatter(x="sepal_length", y="sepal_width", col="species")
hvplot.show(plot)

The above code creates several plots, based on the species part of the iris data set, resulting in the picture below:
hvplot gridspace example with too many columns

But now imagine there were not 3 different species, but twenty. The plot would get to wide so I'd like to break the line after a few plots. But I couldn't find any "maximum columns" parameter. A normal grid expects another column to define the rows which I don't have.

Any suggestions would help.
Sander van den Oord
  • 10,986
  • 5
  • 51
  • 96
MichaelA
  • 1,866
  • 2
  • 23
  • 38

2 Answers2

3

The HoloViews object returned by the call above is a GridSpace, which uses column headers to indicate values along the outer row and column dimensions. If you were to break the line in such a plot, the column headers would get all mixed up, so I'm pretty sure that could never work directly.

Even so, you can pull out the individual items in the GridSpace and put them into a HoloViews Layout (which does allow line breaking), as long as you relabel each plot so you know the value along the species dimension:

import seaborn as sns, hvplot.pandas, holoviews as hv

iris = sns.load_dataset('iris')
plot = iris.hvplot.scatter(x="sepal_length", y="sepal_width", col="species")
p2   = hv.Layout([i.relabel(n).opts() for n,i in plot.items()]).cols(2)
hvplot.show(p2)

screenshot

James A. Bednar
  • 3,195
  • 1
  • 9
  • 13
  • thanks James, as you are partially guilty in luring me away from pure matplotlib, it is highly appreciated that you help with initial struggles :D. Anyhow, is there a reason why your are calling .opts() in the list comprehension. It does not seem to be absolutely necessary – MichaelA Jan 08 '20 at 09:24
  • Good question. Without that the plots were too large for my screen, but I don't know why adding .opts() alone would affect that. – James A. Bednar Jan 09 '20 at 05:27
  • In any case Sander's solution is better than mine; I like hvPlot but know HoloViews better, so I fall back to HoloViews solutions even when hvPlot already takes care of it... – James A. Bednar Jan 09 '20 at 05:28
3

In your case I would not create a Gridspace (by using keyword 'row' and 'col') but a Layout.
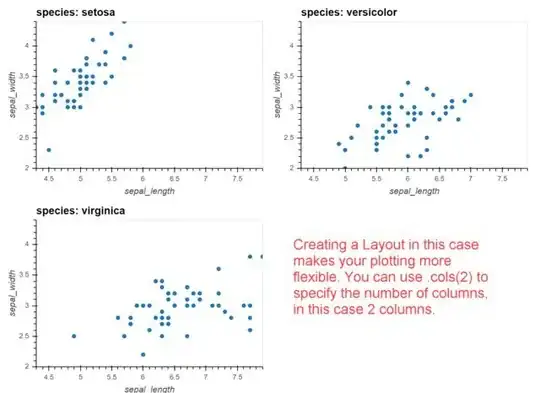
When you have a Layout you can adjust the number of columns easily with .cols(2).

Using hvplot you have to use keyword 'by' and 'subplots=True' instead of 'col'.

See the code below:

iris.hvplot.scatter(
    x='sepal_length',
    y='sepal_width',
    by='species',
    subplots=True,
).cols(2)


Resulting plot:

creating a layout to show plots

Sander van den Oord
  • 10,986
  • 5
  • 51
  • 96
  • It definitly sounds more difficult than it is - anyway, is there an option to make the yaxis shared. .opts(shared_axes=True) does not seem to work for me – MichaelA Jan 08 '20 at 09:19
  • Which version of hvplot and holoviews are you using? As you can see in my image, my axes are shared and linked, because the y-axis and x-axis names are equal over all plots. You can install the latest version with: https://stackoverflow.com/questions/59363729/install-the-latest-git-versions-of-holoviews-hvplot-panel-datashader-and-para – Sander van den Oord Jan 08 '20 at 09:34
  • About the difficulty: this is the nice thing about hvplot, it does all this for you :) So you need to use less of the nittigritty of holoviews and bokeh. – Sander van den Oord Jan 08 '20 at 09:36
  • I'm afraid I've been not precise in my question. My axes are also shared concerning scaling, but I'd like to supress repeated y and x labels. (In my real case, my y-labels are rather long). The original col approach does this already, but I can't find a solution for the grid part – MichaelA Jan 08 '20 at 10:41
  • Then you would have to iterate over the plots to remove the ylabel from all but the first plot which is similar to James Bednar's solution: all_plots = []; for nr, species in enumerate(iris.species.unique()): plot = iris[iris.species == species].hvplot(kind='scatter', x='sepal_length', y='sepal_width', width=400) if nr>0: plot.opts(ylabel='') all_plots.append(plot); hv.Layout(all_plots).cols(2) – Sander van den Oord Jan 08 '20 at 11:48