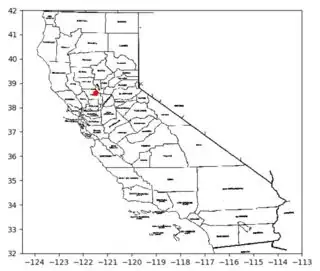
I have an image in python. It's a map of california, and I need to place some point on this map.
The coordonate of each point are retrieve from a csv. But the value of each coordinate are in latitude/longitude. So, i need to convert it to the dimension of my picture.
So, here's is the description of my situation:
import numpy as np
import matplotlib.pyplot as plt
import matplotlib.image as mpimg

# dpi for the saved figure: https://stackoverflow.com/a/34769840/3129414
dpi = 120

img = mpimg.imread("california_map_blank.png")
height, width, bands = img.shape

# Update figure size based on image size
figsize = width / float(dpi), height / float(dpi)

# Create a figure of the right size with one axes that takes up the full figure
figure = plt.figure(figsize=figsize)
axes = figure.add_axes([0, 0, 1, 1])

# Draw the image
axes.imshow(img, interpolation='nearest')
Here's the result:
First i need to modify the y-axis. I need to inverse it so the 0 start at the bottom. Then I need to modify the value of the axis, [31,42] for y-axis and [-123,-114] for x-axis. Because the point I want to place in this map are all in this range. One example of coordinate: 41.76440000093729, -124.1998.
Now here's my question. Is it possible to achieve this ? How ?
PS: I use python 3.6, and I already know how to place point on the image. I don't need to save the image just showing.
PPS: My final goal in fact is to convert lat/lon data into coordinate in a picture so if you know any other way to do it(in Python of course) please tell me.
EDIT: If I apply this: axes.set_xlim(-124.5,-114) it give me this:
I want to have the axis with this range but with the whole image.
In fact, at the end I will not display the axis I will just put the map with the points, but I need to place the point on the map so I think I need to go through this step.
EDIT2: I tried this: axes.imshow(img[::-1], origin='lower', interpolation='nearest') it works fine to reverse the axis but when I draw a point python draw it in the same place when I the axis was normal.


