0

This is my code:

import pandas as pd
cols= ['DD','MM','YYYY','HH'] #names
DD,MM,YYYY,HH=[1,2,None,4,5,5],[1,1,1,2,2,3],[2014,2014,2014,2014,2014,2014],[20,20,20,18,18,18] #data
df = pd.DataFrame(list(zip(DD,MM,YYYY,HH)), columns =cols )
print (df)
a=pd.crosstab(df .HH, df .MM,margins=True)
print (a)

I would like to view results in a table format. Table borders or at least the same number of digits would solve the problem. I want to see the table on console without any graphical window.
Evandrojs
  • 11
  • 3
  • 1
    What have you tried based on your own research and the [pandas styling documentation](https://pandas.pydata.org/pandas-docs/stable/user_guide/style.html)? And what was the result? – G. Anderson Jan 16 '20 at 18:30
  • Thanks for the comment, mr. @G.Anderson. But with this page only relates to highlihts and so on. – Evandrojs Jan 16 '20 at 19:24
  • How about [How to display pandas DataFrame of floats using a format string for columns?](https://stackoverflow.com/questions/20937538/how-to-display-pandas-dataframe-of-floats-using-a-format-string-for-columns) – G. Anderson Jan 16 '20 at 19:28
  • IIUC, `display()`, is it like what you want? – nucsit026 Jan 16 '20 at 19:52

1 Answers1

0

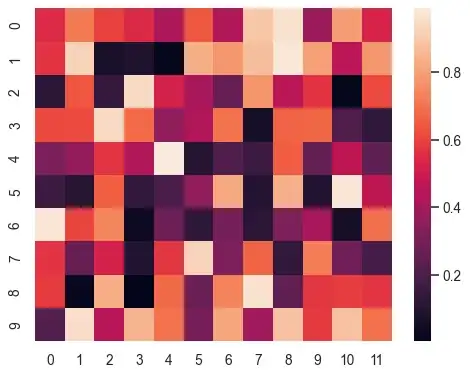
If you want a nicely looking crosstab you can use seaborn.heatmap

An example

>>> import numpy as np; np.random.seed(0)
>>> import seaborn as sns; sns.set()
>>> uniform_data = np.random.rand(10, 12)
>>> ax = sns.heatmap(uniform_data)

result would look like this:

You can find many examples that show how to apply this, e.g.:

Update

In order to simply display the crosstab in a formatted way you can skip the print and display like this

import pandas as pd
cols= ['DD','MM','YYYY','HH'] #names
DD,MM,YYYY,HH=[1,2,None,4,5,5],[1,1,1,2,2,3],[2014,2014,2014,2014,2014,2014],[20,20,20,18,18,18] #data
df = pd.DataFrame(list(zip(DD,MM,YYYY,HH)), columns =cols )
print (df)
a = pd.crosstab(df .HH, df .MM,margins=True)
display(a)

which will yield the same result as:

pd.crosstab(df .HH, df .MM,margins=True)
andrzejwp
  • 922
  • 4
  • 11
  • Thanks for the answer. But this solution would create a plot. I want rather a table format in the pandas or pretty table style. So one can see results in the console. – Evandrojs Jan 16 '20 at 19:09
  • How about just running pd.crosstab() without using print() ? – andrzejwp Jan 16 '20 at 19:15