I am trying to write a pine script with two indicators one overlaid on the chart (EMA) and another on its own?(Stoch) I cannot seem to find any info on how to separate these (Visually) but keep them within 1 pine script, ie to be able to take trading decisions based on these.
Asked
Active
Viewed 3.2k times
3 Answers
19
The earlier answer from Luc is right, unfortunately. Each script can either create plots that are overlaid on the default price chart, or shown in a different pane, but not both. But there is a workaround.
Suppose you've made some non-trivial calculation in your script and you'd like to put it in different pane. E.g. the next code:
//@version=4
study(title="Stochastic", shorttitle="Stoch", format=format.price, precision=2)
periodK = input(14, title="K", minval=1)
periodD = input(3, title="D", minval=1)
smoothK = input(3, title="Smooth", minval=1)
k = sma(stoch(close, high, low, periodK), smoothK)
d = sma(k, periodD)
plot(k, title="%K", color=color.blue)
plot(d, title="%D", color=color.orange)
h0 = hline(80)
h1 = hline(20)
fill(h0, h1, color=color.purple, transp=75)

// This next plot would work best in a separate pane
someNonTrivialCalculatedSeries = close
plot(ema(someNonTrivialCalculatedSeries, 25), title="Exporting Plot")
Because they have different scale, one of them most likely will break another indicator's scale.
So you'd like show Stoch in different pine, whereas ema() should be overlayed with the main chart. For that you should make the next steps:
Turn off in the study's the extra plot to return scale to normal:
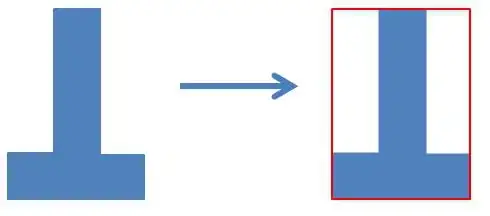
Apply to the chart the next script:
//@version=4
study("NonOverlayIndicator", overlay=true)
src = input(defval=close, type=input.source)
plot(src)
Choose in the second's script inputs source required plot from the first script:


And voilà - you got the plots in different pines:

But if you want split the plots because you have retrictions on amount of studies you allowed to apply (e.g. 3 for free-account) - that won't help you.
Simon East
- 55,742
- 17
- 139
- 133
Michel_T.
- 2,741
- 5
- 21
- 31
-
Good answer which helped me a lot, many thanks Michel. Small detail for improvement is that overlay should be false. – bevada May 03 '20 at 10:22
-
Thanks for this! Really helpful answer. Since [someone else has already published a script called "Line Chart Source"](https://www.tradingview.com/v/YTGnK0sk/) similar to the second one you mention, you can just apply it to your chart and choose the source. But yes, it also takes up an additional study slot. – Simon East Dec 31 '20 at 04:18
-
the variables in the first script are not listed in the second script inputs source selection, can I know how to make them display there? – Beeing Jk Dec 09 '21 at 12:14
-
I got unlimited panes working with a trick. But the problem is that the panes are empty, not drawn. If anyone can find workaround for the drawing, that would be great. Trick: open console (Ctrl+Shift+I) and type `window.user.is_pro=true;` and `window.user.pro_plan="pro_premium";` – lxkarthi Mar 02 '22 at 12:44
4
It cannot be done. A script runs either in overlay=true mode on the chart, in which case it cannot direct plots elsewhere, or in a separate pane when overlay=false (the default).
When the script is running in a pane, it can change the color of the chart bars using barcolor(), but that's the only way it can modify the chart.
It is possible to rescale signals so that multiple bounded (e.g., 0-100, -1 to +1) signals generated by one script appear one on top of the other, but this is typically impossible in overlay mode, as the vertical scale varies with the bars on the chart. The only way for an overlay script to work with its own scale is when it uses No scale, but this prevents the indicator's plots to plot relative to price, and so the chart's bars.
PineCoders-LucF
- 8,288
- 2
- 12
- 21
2
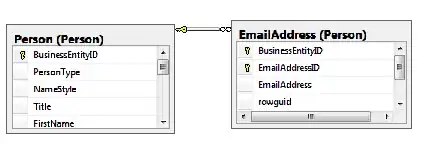
Nice workaround from Michael. Unfortunately, this only seems to work to pass data for one plot. I would like to pass data for 3 different plots to the stock price graph. If I try this, for 'input.source' I can only select the standard sources: "open, high, low, close ...". I can not select the data from other indicators. If I remove plots 2 and 3, it works as Michael described. Anybody has a workaround for the workaround..? ;-)
Ray Johnson
- 97
- 1
- 9
-
This seems to be a documented limitation: "Only one external input can be used at a time by the strategy." https://www.tradingview.com/blog/en/use-an-input-from-another-indicator-with-your-strategy-19584/ – Ray Johnson Jan 08 '21 at 23:03
-
It is necessary to create two indicators, one adapted for the chart, the other for the panel. – AnyDozer Jan 09 '21 at 06:53
-
1Yes, as shown below with an example. The thing is that you can 'pass' only one plot from the non-overlay indicator to the overlay indicator. – Ray Johnson Jan 10 '21 at 21:22
-
Yeah, I'm also seeing this limitation. If script A has multiple plots then NONE of them seem to show up in the "input.source" selector in script B. Frustrating. – Simon East Feb 02 '21 at 06:15