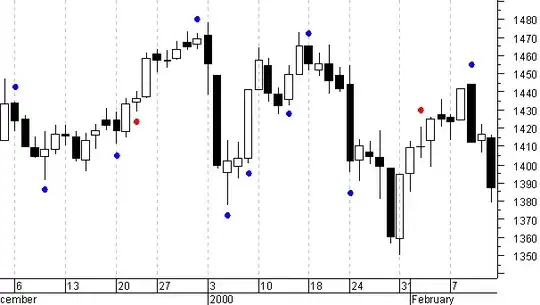
My attempts to set figure size in lmplot have failed and therefore I would welcome your advice.
My code:
sns.set(rc={'figure.figsize':(18,16)})

sns.lmplot(x = 'index', y = 'values', data = data.reset_index(), hue = 'data' )
The plot that is produced below ignores the figure settings:
