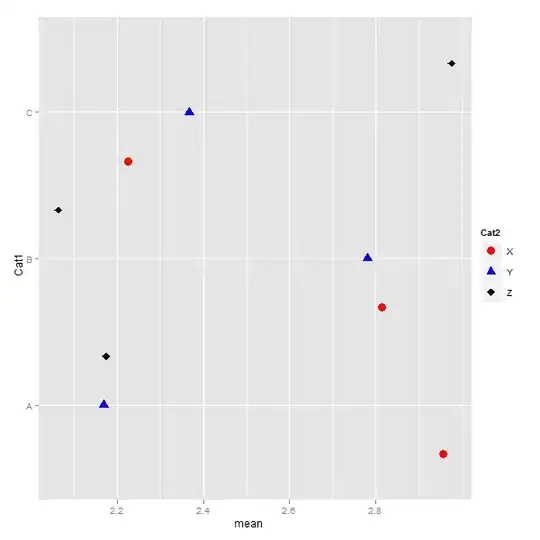
I have created figure with matplotlib:
 and I would like to add each point tag but this data should be retrieved from a column ,so each point gets tag based on the "name" column in the dataframe.
Is there any way to add the data based on the column?
I have try to add it with this:
plt.text(1, 1, df['name'], fontsize=9)
but it didn't work and I got this error:
ValueError: The truth value of a Series is ambiguous. Use a.empty, a.bool(), a.item(), a.any() or a.all().
this is how I built the whole graph:
df_PCA=pca_func(StandardNormalVariate(df_time.iloc[:,15:]))

#PLOT
fig = plt.figure(figsize = (12,8))
ax = fig.add_subplot(1,1,1)
ax.set_xlabel('PCA1', fontsize = 15)
ax.set_ylabel('PCA2', fontsize = 15)
ax.set_title('PCA - 6 Treatments- 21/06/2019 14:00', fontsize = 20)
#plt.text(1, 1, df_time['name'], fontsize=9)

targets = df_time.code.unique()
colors = ['tab:red','tab:green','tab:blue','tab:orange','tab:purple','tab:cyan']
for target, color in zip(targets,colors):
    #goes to line. and check of 1,2,3,4,5,6 are true or false, 6 times total, and if true gives the color.
    indicesToKeep = df['code'] == target
    ax.scatter(df_PCA.loc[indicesToKeep, 'principal component 1']
               , df_PCA.loc[indicesToKeep, 'principal component 2']
               , c = color
               , s = 100)
ax.legend(targets)
ax.grid()
My end goal: to add the names of observation beside each point in order to identify the top-right point and to rmove it from my dataset
