I am comparing some algorithmic results using matplotlib.pyplot, however it is very difficult to understand what is going on since several lines have the same exact color. Is there a way to avoid this? I don't think that pyplot has only seven colors, has it?
Asked
Active
Viewed 2.0k times
9
-
http://matplotlib.sourceforge.net/users/pyplot_tutorial.html – Ion May 17 '11 at 07:42
-
I suggest you have a look at this post: http://stackoverflow.com/questions/4805048/how-to-get-different-lines-for-different-plots-in-a-single-figure – Dec 26 '13 at 11:24
4 Answers
13
For Python 3, from the solutions above you can use:
colormap = plt.cm.nipy_spectral
colors = colormap(np.linspace(0, 1, number_of_plots))
ax.set_prop_cycle('color', colors)
or:
import seaborn as sns
colors = sns.color_palette('hls', number_of_plots)
ax.set_prop_cycle('color', colors)
12
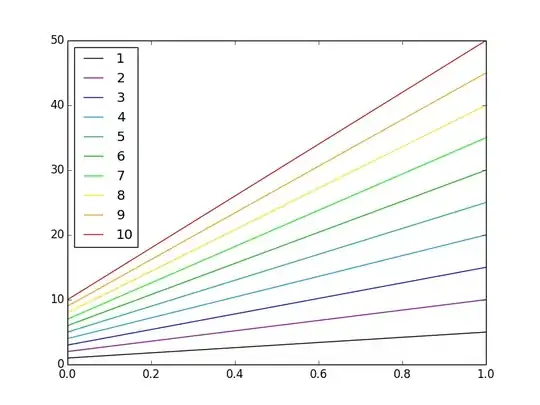
The best thing if you know how many plots you are going to plot is to define the colormap before:
import matplotlib.pyplot as plt
import numpy as np

fig1 = plt.figure()
ax1 = fig1.add_subplot(111)
number_of_plots=10
colormap = plt.cm.nipy_spectral #I suggest to use nipy_spectral, Set1,Paired
ax1.set_color_cycle([colormap(i) for i in np.linspace(0, 1,number_of_plots)])
for i in range(1,number_of_plots+1):
    ax1.plot(np.array([1,5])*i,label=i)

ax1.legend(loc=2)
Using nipy_spectral
G M
- 20,759
- 10
- 81
- 84
-
1Should we be concerned that `set_color_cycle()` is deprecated in `version 1.5`? `plt` suggests to use `set_prop_cycle()` instead (but I haven't tried yet). – dwanderson Oct 04 '16 at 21:35
6
I would also suggest the use of Seaborn. With this library it is very easy to generate sequential or qualitative colour palettes with the number of colours you need. There is also a tool to visualize the palettes. For example:
import seaborn as sns

colors = sns.color_palette("hls", 4)
sns.palplot(colors)
plt.savefig("pal1.png")
colors = sns.color_palette("hls", 8)
sns.palplot(colors)
plt.savefig("pal2.png")
colors = sns.color_palette("Set2", 8)
sns.palplot(colors)
plt.savefig("pal3.png")
These are the resulting palettes:
Ramon Crehuet
- 3,679
- 1
- 22
- 37
5
Matplotlib has more than seven colors. You can specify your color in many ways (see http://matplotlib.sourceforge.net/api/colors_api.html).
For example, you can specify the color using an html hex string:
pyplot.plot(x, y, color='#112233')
Abdelraouf Ouadjaout
- 124
- 1
- 5


