I have two columns , I have tried this:
df[['EYE_WIDTH','LANE']].groupby(['EYE_WIDTH','LANE']).size().unstack()
Now I got this table:
LANE          0      1      2      3      4      5      6      7      8   \
EYE_WIDTH
31.2         NaN    NaN    NaN    NaN    NaN    NaN    1.0    NaN    NaN
35.1         NaN    NaN    NaN    NaN    NaN    1.0    NaN    1.0    NaN
39.0         NaN    1.0    NaN    2.0    NaN    NaN    2.0    1.0    NaN
42.9         1.0    5.0    5.0   10.0    2.0    5.0    9.0   17.0    3.0
46.8        19.0   14.0   17.0   23.0   27.0   31.0   42.0   39.0   27.0
50.7        84.0   48.0   63.0   93.0   69.0   95.0  137.0  130.0   99.0
54.6       204.0  173.0  176.0  206.0  158.0  158.0  207.0  182.0  199.0
58.5       350.0  308.0  296.0  284.0  257.0  214.0  237.0  228.0  235.0
62.4       282.0  278.0  242.0  257.0  275.0  236.0  259.0  206.0  237.0
66.3       112.0  180.0  212.0  167.0  213.0  244.0  152.0  223.0  197.0
70.2        26.0   64.0   65.0   41.0   80.0   91.0   39.0   59.0   76.0
74.1         2.0   11.0    4.0    1.0    5.0    9.0    2.0    1.0    3.0
78.0         NaN    NaN    NaN    NaN    NaN    NaN    1.0    NaN    1.0

LANE          9      10     11     12     13     14     15
EYE_WIDTH
31.2         NaN    NaN    NaN    NaN    NaN    NaN    NaN
35.1         NaN    1.0    NaN    1.0    NaN    NaN    NaN
39.0         3.0    3.0    3.0    2.0    3.0    6.0    NaN
42.9        11.0    6.0    7.0    3.0   14.0    7.0    7.0
46.8        43.0   39.0   41.0   15.0   16.0   29.0   35.0
50.7       101.0  114.0  144.0   56.0   78.0   96.0  116.0
54.6       206.0  210.0  193.0  187.0  158.0  186.0  283.0
58.5       275.0  231.0  246.0  251.0  278.0  295.0  344.0
62.4       219.0  233.0  217.0  203.0  278.0  257.0  212.0
66.3       167.0  196.0  163.0  243.0  197.0  161.0   73.0
70.2        50.0   46.0   58.0   99.0   53.0   40.0   10.0
74.1         2.0    3.0    5.0   20.0    5.0    4.0    1.0
78.0         NaN    NaN    NaN    NaN    NaN    NaN    NaN
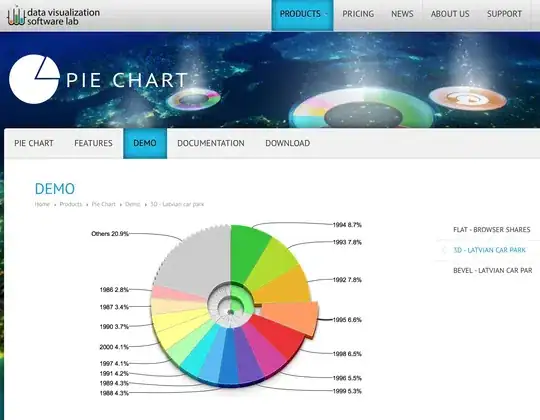
Now i want to visualize these relationship ,one thing i have in mind is fitting them along curves like below  along with that it is good if I can also represent them in heatmap.
First few lines of data
   EYE_WIDTH  LANE
     66.3    11
     58.5    12
     70.2    13
     66.3     7
     58.5    14
     58.5     0
     62.4     1
     62.4     2
     54.6     3
     62.4     4
     58.5     5
     50.7     6
     62.4    15
     66.3     8
     70.2     9
     58.5    10
     66.3     1
     58.5     7
     66.3     8
     50.7     9
     62.4     0
     62.4    11
     62.4    12
     66.3    13
     66.3    15
     58.5    10
     50.7     2
     58.5     3
     54.6     4
     50.7     5
     50.7     6
     58.5    14
     62.4     1
     62.4     2
     62.4     3
     62.4     4
     54.6     5
     62.4     6
     58.5     7
     62.4     8
     66.3     9
     62.4    10
     62.4    11
     62.4    12
     62.4    13
     54.6     0
     66.3    15
     62.4    14
     58.5    15
     54.6    13
So there are 13 distinct EYE_WIDTH values and 16 distinct LANE ,now by using groupby and size unstack , I got to know that how number of times each lane is associated with the distinct EYE_WIDTH. Now I need to visualize this relationship
I tried:
df[['EYE_WIDTH','LANE']].groupby(['EYE_WIDTH','LANE']).size().unstack().plot()

