2

I have an audio recording wav file of a cricket chirping, every so often a chirp occurs for ~ 0.01 seconds at about 20kHz. I would like to use R to detect at what times during the recording the specific frequency (20kHz) occurs/starts.

Wave Object

Number of Samples:      4041625
Duration (seconds):     91.65
Samplingrate (Hertz):   44100
Channels (Mono/Stereo): Mono
PCM (integer format):   TRUE
Bit (8/16/24/32/64):    16 
Maurits Evers
  • 49,617
  • 4
  • 47
  • 68
  • 1
    That's an interesting problem to tackle. It would be good if you could host the file somewhere to let others try to find a solution. – anddt Feb 27 '20 at 11:03

2 Answers2

1

I do believe dfreq from the seewave package is what you're after. The method returns the dominant frequency (the one with the highest amplitude) over time (in seconds). Here's an exampleof how you could get that information:

library(tuneR)
library(seewave)

# Read audio file
crickets <- readWave("~/crickets.wav")

# Get dominant frequency
d <- dfreq(crickets, plot = FALSE)

head(d)

#               x        y
# [1,] 0.00000000 0.000000
# [2,] 0.02332295 0.000000
# [3,] 0.04664589 0.000000
# [4,] 0.06996884 0.000000
# [5,] 0.09329179 0.000000
# [6,] 0.11661474 2.583984

anddt
  • 1,589
  • 1
  • 9
  • 26
1

As @anddt says, dfreq is a good option although it often requires some tuning of various parameters such as threshold and wl. Here's a toy example with some made up data containing noise.

library(seewave)
library(tuneR)

chirp = sine(freq = 20000, duration = 0.01, xunit = 'time')
silence_0.2 = silence(duration = 0.2, xunit = 'time')
silence_0.1 = silence(duration = 0.1, xunit = 'time')
noise_0.2 = noise(kind='pink', duration=0.2, xunit = 'time')
noise_0.1 = noise(kind='pink', duration=0.1, xunit = 'time')
signal = bind(silence_0.2, chirp, noise_0.1, silence_0.2, chirp, silence_0.1, noise_0.2, chirp, noise_0.2, silence_0.2)

# threshold removes noise, wl is the window length of the fourier transform, smaller 
# values give more accuracy for time but noise gets more troublesome
peaks = data.frame(dfreq(signal, threshold = 10, wl = 128, plot=F))
peaks[is.na(peaks)] = 0
names(peaks) = c('time', 'frequency')
peaks$frequency[peaks$frequency < 19.9 | peaks$frequency > 20.1] = 0

startindices = which(diff(peaks$frequency) > 19)
endindices = which(diff(peaks$frequency) < -19)
starttimes = peaks[startindices, 1]
endtimes = peaks[endindices, 1]

plot(signal, col='grey')
abline(v = starttimes, col='green')
abline(v = endtimes, col='red')

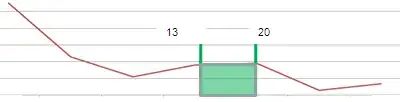
The result looks like this. Green vertical lines for the starts, and red vertical lines for the ends of chirps.

enter image description here

Andrew Chisholm
  • 6,362
  • 2
  • 22
  • 41