I've read all of the documentation, and I can't seem to figure this one out. I have the following URL for an image chart, however it caps the data at 100 for some reason. I've been going crazy trying to figure out what that is.
Asked
Active
Viewed 74 times
1 Answers
1
chd=t: (coming from Google Image Charts format) limits data to 100. See the first line of our documentation here.
Basic text-formatted data lets you specify floating point values from 0—100, inclusive, as numbers. Values below zero are marked as missing; values above 100 are truncated to 100.
But the good news, we did not stop at being a drop-in-replacement for Google Image Charts....... We've improved it!
Use our Awesome Text format instead, change chd=t: to chd=a: and you are done!
with chd=t:
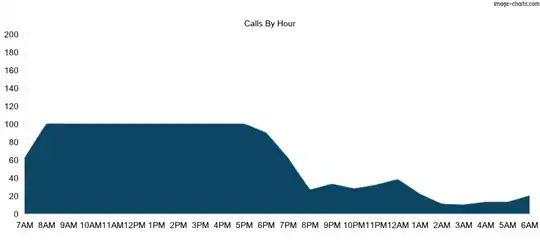
https://image-charts.com/chart?chco=167DB3&chd=t:62,102,154,145,153,212,215,171,184,148,103,90,62,27,33,28,32,38,22,11,10,13,13,20&chm=B,0D4564,0,0,0&chma=0,0,20,10&chs=900x400&cht=lc&chxl=0:|7AM|8AM|9AM|10AM|11AM|12PM|1PM|2PM|3PM|4PM|5PM|6PM|7PM|8PM|9PM|10PM|11PM|12AM|1AM|2AM|3AM|4AM|5AM|6AM&chxt=x,y&chtt=Calls+By+Hour&chxr=1,0,200
with chd=a:
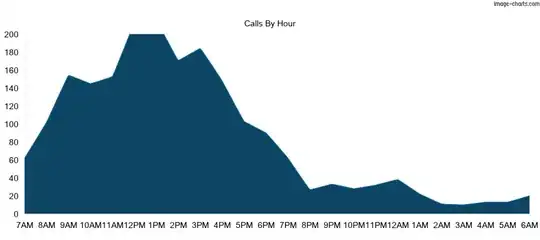
https://image-charts.com/chart?chco=167DB3&chd=a:62,102,154,145,153,212,215,171,184,148,103,90,62,27,33,28,32,38,22,11,10,13,13,20&chm=B,0D4564,0,0,0&chma=0,0,20,10&chs=900x400&cht=lc&chxl=0:|7AM|8AM|9AM|10AM|11AM|12PM|1PM|2PM|3PM|4PM|5PM|6PM|7PM|8PM|9PM|10PM|11PM|12AM|1AM|2AM|3AM|4AM|5AM|6AM&chxt=x,y&chtt=Calls+By+Hour&chxr=1,0,200
FGRibreau
- 7,021
- 2
- 39
- 48