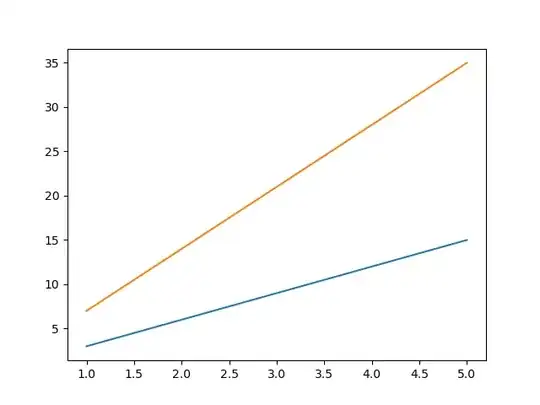
I have a class that generates lists of data from mathematical equations I formulated to model a system over time. The class can take different numbers for the different variables in the equations, therefore you can create objects from the class that have different model output. I would like to plot the output from different objects on the same plot, but when I try to do so I get the following error: ValueError: x and y must have same first dimension, but have shapes (5,) and (10,). I am plotting using matplotlib. An example of what the code looks like is here:
import matplotlib.pyplot as plt

class Foo:
    def __init__(self, x=[1,2,3,4,5], y=[], var1=None, var2=None):
        self.x = x
        self.y = y
        self.var1 = var1
        self.var2 = var2

    def calculate_y(self, index):
        return (self.var1 + self.var2) * self.x[index]

    def run_calculation(self):
        for i in range (0, len(self.x)):
            self.y.append(self.calculate_y(i))

obj1 = Foo(var1 = 1, var2 = 2)
obj2 = Foo(var1 = 3, var2 = 4)

obj1.run_calculation()
obj2.run_calculation()

plt.figure(1)
plt.plot(obj1.x, obj1.y)
plt.plot(obj2.x, obj2.y)
plt.show()
I am using the lists generated by the class methods from the individual objects to plot. Any idea why I'm getting this error and am unable to plot? Thanks in advance.
