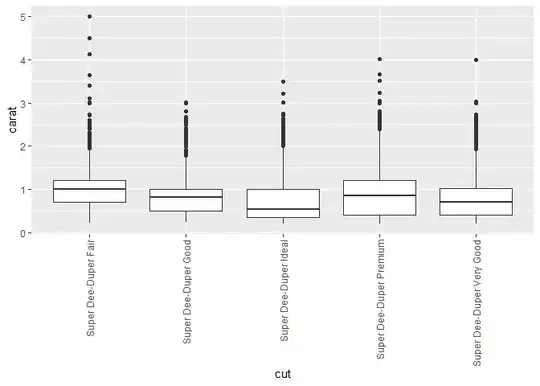
I tried to plot a dataframe in shiny using r. This df has multiple columns (x, y1, y2..). I am not sure how many y are there, but at least one. And I want to plot all figures (y1~x, y2~x....) as a big one. Since I am using shiny, it's also required to plot all of them as one output (a big one).
I tried the first method in this post (facet_grid(series ~ .)). The problem is that different y may be in different magnitude, so I need to plot them separately. But the y-scale is the same for all figures, and I cannot figure out how to scale the y-axis.
Can anyone give me some hint, either functions or settings that I can use to solve this problem? Thanks. (I hope my description is clear enough)
