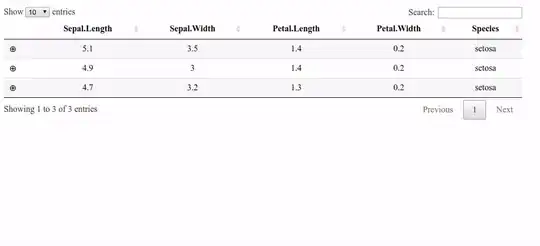
I have a nested data table that is rendered in my app. The data table is pre-populated with data, however, I got a request from the users that they will need to be able to edit the data in the child rows. My data table is below. For example, the user might need to go in and change the Share (%) for Daytime. In changing that value it will also need to update the parent row.
The issue I am trying to get around is when I click to edit a single cell in the child table the whole table disappears and a text box shows up.
The Issue
Code
# Merge the row details
subdats <- lapply(
list(df2),
purrr::transpose
)
# Dataframe for the datatable
Dat <- cbind(
" " = "⊕",
df1,
details = I(subdats)
)
callback_js = JS(
"table.column(1).nodes().to$().css({cursor: 'pointer'});",
"",
"// make the table header of the nested table",
"var format = function(d, childId){",
" if(d != null){",
" var html = ",
" '<table class=\"display compact hover\" id=\"' + childId + '\"><thead><tr>';",
" for (var key in d[d.length-1][0]) {",
" html += '<th>' + key + '</th>';",
" }",
" html += '</tr></thead></table>'",
" return html;",
" } else {",
" return '';",
" }",
"};",
"",
"// row callback to style the rows of the child tables",
"var rowCallback = function(row, dat, displayNum, index){",
" if($(row).hasClass('odd')){",
" $(row).css('background-color', 'white');",
" $(row).hover(function(){",
" $(this).css('background-color', 'white');",
" }, function() {",
" $(this).css('background-color', 'white');",
" });",
" } else {",
" $(row).css('background-color', 'white');",
" $(row).hover(function(){",
" $(this).css('background-color', 'white');",
" }, function() {",
" $(this).css('background-color', 'white');",
" });",
" }",
"};",
"",
"// header callback to style the header of the child tables",
"var headerCallback = function(thead, data, start, end, display){",
" $('th', thead).css({",
" 'border-top': '3px solid indigo',",
" 'color': 'white',",
" 'background-color': 'white'",
" });",
"};",
"",
"// make the datatable",
"var format_datatable = function(d, childId){",
" var dataset = [];",
" var n = d.length - 1;",
" for(var i = 0; i < d[n].length; i++){",
" var datarow = $.map(d[n][i], function (value, index) {",
" return [value];",
" });",
" dataset.push(datarow);",
" }",
" var id = 'table#' + childId;",
" var subtable = $(id).DataTable({",
" 'data': dataset,",
" 'autoWidth': true,",
" 'deferRender': true,",
" 'info': false,",
" 'lengthChange': false,",
" 'ordering': d[n].length > 1,",
" 'order': [],",
" 'paging': false,",
" 'scrollX': false,",
" 'scrollY': false,",
" 'searching': false,",
" 'sortClasses': false,",
" 'rowCallback': rowCallback,",
" 'headerCallback': headerCallback,",
" 'columnDefs': [",
" {targets: -1, visible: false},",
" {targets: 0, orderable: false, className: 'details-control'},",
" {targets: '_all', className: 'dt-center'}",
" ]",
" }).column(0).nodes().to$().css({cursor: 'pointer'});",
" }",
"",
"// display the child table on click",
"table.on('click', 'td.details-control', function(){",
" var tbl = $(this).closest('table'),",
" tblId = tbl.attr('id'),",
" td = $(this),",
" row = $(tbl).DataTable().row(td.closest('tr')),",
" rowIdx = row.index();",
" if(row.child.isShown()){",
" row.child.hide();",
" td.html('⊕');",
" } else {",
" var childId = tblId + '-child-' + rowIdx;",
" row.child(format(row.data(), childId)).show();",
" td.html('⊖');",
" format_datatable(row.data(), childId);",
" }",
"});")
# Render the table
output$daypartTable <- DT::renderDataTable({
Dat <- Dat
DT::datatable(Dat, callback = callback_js, escape = -2, editable = TRUE,
options = list(
columnDefs = list(
list(visible = FALSE, targets = ncol(Dat)),
list(orderable = FALSE, className = 'details-control', targets = 1),
list(className = "dt-center", targets = "_all")
)
)
)
})
Child table structure (df2):
structure(list(Daypart = c("Daytime", "Early Fringe", "Early Morning",
"Early News", "Late Fringe", "Late News", "Prime Access", "Prime Time",
"Total"), `Share (%)` = c(15L, 10L, 15L, 10L, 10L, 10L, 15L,
15L, 100L), `Spot:30 (%)` = c(0, 0, 0, 0, 0, 0, 0, 0, 0), `Spot:15 (%)` = c(0,
0, 0, 0, 0, 0, 0, 0, 0), `Demo Impressions` = c("368,381", "245,588",
"368,381", "245,588", "245,588", "245,588", "368,381", "368,381",
"2,455,876"), Gross = c("$0", "$0", "$0", "$0", "$0", "$0", "$0",
"$0", "$0"), Net = c("$0", "$0", "$0", "$0", "$0", "$0", "$0",
"$0", "$0"), `Gross CPM` = c("$0", "$0", "$0", "$0", "$0", "$0",
"$0", "$0", "$-")), .Names = c("Daypart", "Share (%)", "Spot:30 (%)",
"Spot:15 (%)", "Demo Impressions", "Gross", "Net", "Gross CPM"
), row.names = c(NA, -9L), class = "data.frame")
        Daypart Share (%) Spot:30 (%) Spot:15 (%) Demo Impressions Gross Net Gross CPM
1       Daytime        15           0           0          368,381    $0  $0        $0
2  Early Fringe        10           0           0          245,588    $0  $0        $0
3 Early Morning        15           0           0          368,381    $0  $0        $0
4    Early News        10           0           0          245,588    $0  $0        $0
5   Late Fringe        10           0           0          245,588    $0  $0        $0
6     Late News        10           0           0          245,588    $0  $0        $0
7  Prime Access        15           0           0          368,381    $0  $0        $0
8    Prime Time        15           0           0          368,381    $0  $0        $0
9         Total       100           0           0        2,455,876    $0  $0        $-
Parent table structure (df1):
structure(list(Market = "ALBANY, GA", Gross = "$0", Net = "$0",
    GRP = 100, `Demo Impressions` = "238,792", `Gross CPP` = "$0",
    `Gross CPM` = "$0"), .Names = c("Market", "Gross", "Net",
"GRP", "Demo Impressions", "Gross CPP", "Gross CPM"), row.names = c(NA,
-1L), class = "data.frame")
      Market Gross Net GRP Demo Impressions Gross CPP Gross CPM
1 ALBANY, GA    $0  $0 100          238,792        $0        $0


