The method norm.ppf() takes a percentage and returns a standard deviation multiplier for what value that percentage occurs at.
It is equivalent to a, 'One-tail test' on the density plot.
From scipy.stats.norm:
ppf(q, loc=0, scale=1) Percent point function (inverse of cdf — percentiles).
Standard Normal Distribution
The code:
norm.ppf(0.95, loc=0, scale=1)
Returns a 95% significance interval for a one-tail test on a standard normal distribution (i.e. a special case of the normal distribution where the mean is 0 and the standard deviation is 1).
Our Example
To calculate the value for OP-provided example at which our 95% significance interval lies (For a one-tail test) we would use:
norm.ppf(0.95, loc=172.7815, scale=4.1532)
This will return a value (that functions as a 'standard-deviation multiplier') marking where 95% of data points would be contained if our data is a normal distribution.
To get the exact number, we take the norm.ppf() output and multiply it by our standard deviation for the distribution in question.
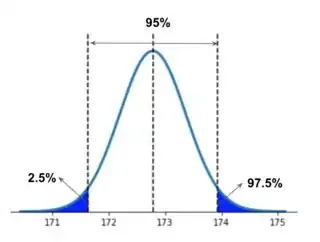
A Two-Tailed Test
If we need to calculate a 'Two-tail test' (i.e. We're concerned with values both greater and less than our mean) then we need to split the significance (i.e. our alpha value) because we're still using a calculation method for one-tail. The split in half symbolizes the significance level being appropriated to both tails. A 95% significance level has a 5% alpha; splitting the 5% alpha across both tails returns 2.5%. Taking 2.5% from 100% returns 97.5% as an input for the significance level.
Therefore, if we were concerned with values on both sides of our mean, our code would input .975 to represent a 95% significance level across two-tails:
norm.ppf(0.975, loc=172.7815, scale=4.1532)
Margin of Error
Margin of error is a significance level used when estimating a population parameter with a sample statistic. We want to generate our 95% confidence interval using the two-tailed input to norm.ppf() since we're concerned with values both greater and less than our mean:
ppf = norm.ppf(0.975, loc=172.7815, scale=4.1532)
Next, we'd take the ppf and multiply it by our standard deviation to return the interval value:
interval_value = std * ppf
Finally, we'd mark the confidence intervals by adding & subtracting the interval value from the mean:
lower_95 = mean - interval_value
upper_95 = mean + interval_value
Plot with a vertical line:
_ = plt.axvline(lower_95, color='r', linestyle=':')
_ = plt.axvline(upper_95, color='r', linestyle=':')