I am producing data and storing them in a numpy array. I am also calculating a variable and storing those variables in another array. They have different shapes and ndims but they are plottable since I tried it with another simple code with the same logic.
import numpy as np
import matplotlib.pyplot as plt

a = np.array([0.05718623, 0.05446883, 0.04395619, 0.03004849])
b = np.array([[0.61745], [0.45825], [0.80061], [0.3719]])
plt.yscale('log')
plt.xscale('log')
plt.plot(a,b)
plt.show()
When I want to plot two arrays with my stored data with the following code:
works = [Data]
probability = [Data2]
plt.yscale('log')
plt.xscale('log')
plt.plot(probability, works)
I get this:
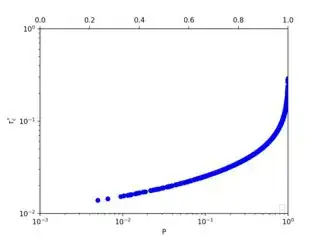
However when I place a 'bo' in the plt.plot() I get this:
works = [Data]
probability = [Data2]
plt.yscale('log')
plt.xscale('log')
plt.plot(probability, works, 'bo')
So I don't want blue spots. Instead of that I want a single curve like blue spots. What am I missing here? What is the problem behind this ? Or this question needs how I produce my data ?
PS: Data.ndim = (1000,) Data2.ndim = (1000,1)


