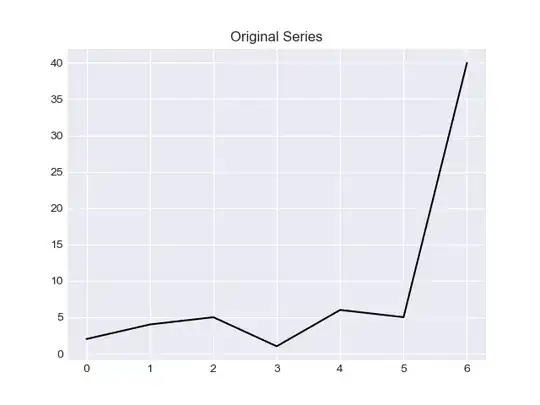
I am making multiple line plots. In each step I add another line to the previous plot. They look like this:
Now I want to delete legend and add names of the countries above the lines, for instance China above blue line. How can I add a text by the lines?
My code for creating those multiple plots:
for i in years:
    yearsi=list((range(1960,i+1)))
    yearsi=map(str,yearsi)
    ax=df.pivot_table(values=yearsi, columns='Country Name').plot()
    ax.set_ylim([0, 1500])
    ax.set_xticks(range(0,61,10))
    ax.set_xticklabels(range(1960, 2021,10))
Where dataframe is like this


