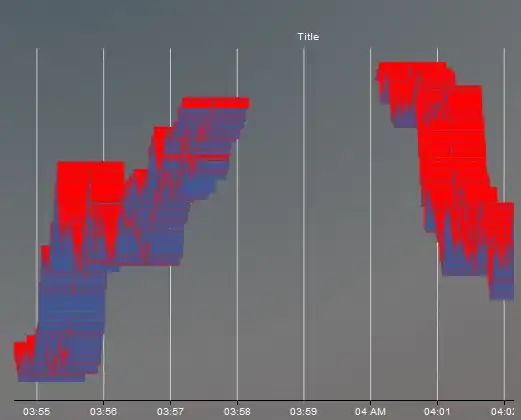
I'm using ggmosaic::geom_mosaic to generate a mosaic plot. I can't seem to get the value labels for my independent variable to show on the X axis. The variable is a labelled factor, with levels labelled "1", "2", "3". I'm sure it's something stupid but I can't figure out what's going on here. Any insight would be appreciated.
ggplot(data = mosaic)+
geom_mosaic(aes(x = product(X, Norm_Dx), fill=Norm_Dx), na.rm=TRUE)

