Here I am using fft function of numpy to plot the fft of PCM wave generated from a 10000Hz sine wave. But the amplitude of the plot I am getting is wrong.
The frequency is coming correct using fftfreq function which I am printing in the console itself. My python code is here.
import numpy as np
import matplotlib.pyplot as plt


frate = 44100
filename = 'Sine_10000Hz.bin' #signed16 bit PCM of a 10000Hz sine wave


f = open('Sine_10000Hz.bin','rb')
y = np.fromfile(f,dtype='int16') #Extract the signed 16 bit PCM value of 10000Hz Sine wave
f.close()

####### Spectral Analysis #########

fft_value = np.fft.fft(y)
freqs = np.fft.fftfreq(len(fft_value))  # frequencies associated with the coefficients:
print("freqs.min(), freqs.max()")

idx = np.argmax(np.abs(fft_value))  # Find the peak in the coefficients
freq = freqs[idx]
freq_in_hertz = abs(freq * frate)
print("\n\n\n\n\n\nfreq_in_hertz")
print(freq_in_hertz)


for i in range(2):
    print("Value at index {}:\t{}".format(i, fft_value[i + 1]), "\nValue at index {}:\t{}".format(fft_value.size -1 - i, fft_value[-1 - i]))

#####


n_sa = 8 * int(freq_in_hertz)
t_fft = np.linspace(0, 1, n_sa)
T = t_fft[1] - t_fft[0]  # sampling interval
N = n_sa   #Here it is n_sample
print("\nN value=")
print(N)

# 1/T = frequency
f = np.linspace(0, 1 / T, N)

plt.ylabel("Amplitude")
plt.xlabel("Frequency [Hz]")
plt.xlim(0,15000)
# 2 / N is a normalization factor  Here second half of the sequence gives us no new information that the half of the FFT sequence is the output we need.
plt.bar(f[:N // 2], np.abs(fft_value)[:N // 2] * 2 / N, width=15,color="red")
Output comes in the console (Only minimal prints I am pasting here)
freqs.min(), freqs.max()
-0.5 0.49997732426303854


freq_in_hertz
10000.0
Value at index 0:       (19.949569768991054-17.456031216294324j)
Value at index 44099:   (19.949569768991157+17.45603121629439j)
Value at index 1:       (9.216783424692835-13.477631008179145j)
Value at index 44098:   (9.216783424692792+13.477631008179262j)

N value=
80000
The frequency extraction is coming correctly but in the plot something I am doing is incorrect which I don't know.
Updating the work:
- When I am change the multiplication factor 10 in the line
n_sa = 10 * int(freq_in_hertz)to 5 gives me correct plot. Whether its correct or not I am not able to understand - In the line
plt.xlim(0,15000)if I increase max value to 20000 again is not plotting. Till 15000 it is plotting correctly. - I generated this
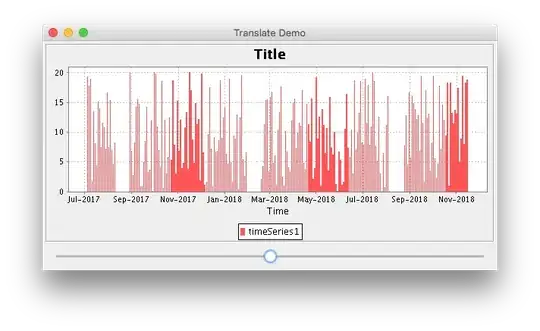
Sine_10000Hz.binusing Audacity tool where I generate a sine wave of freq 10000Hz of 1sec duration and a sampling rate of 44100. Then I exported this audio to signed 16bit with headerless (means raw PCM). I could able to regenerate this sine wave using this script. Also I want to calculate the FFT of this. So I expect a peak at 10000Hz with amplitude 32767. You can see i changed the multiplication factor8instead of10in the linen_sa = 8 * int(freq_in_hertz). Hence it worked. But the amplitude is showing incorrect. I will attach my new figure here