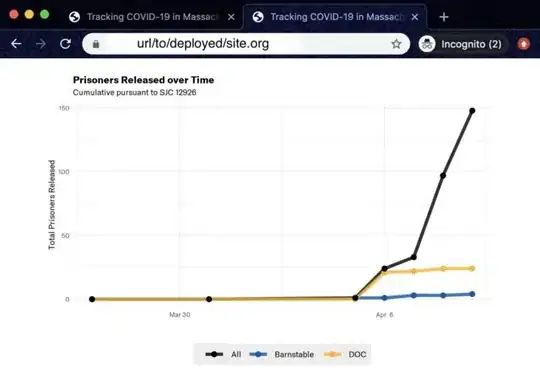
The text in ggplots on my deployed Shiny app is waffling unpredictably between the desired size and shrunken font sizes.
When I host the app locally, all the text looks as I want it to, always. But when I rsync the exact same files over to my server and visit the requisite URL, half of the time the text on ggplots is tiny.
Here is my app being served in Chrome locally through RStudio, with the font as desired:
Here is the deployed app being served in Chrome, with the font small (note other attributes like weight and family are all consistent):
The only place I define font sizes is in the ggplot2 theme, which seems innocuous:
  theme(plot.title= element_text(family="GT America", face='bold'),
        text = element_text(family="GT America", size = 16),
        plot.margin = unit(c(1,1,4,1), "lines"),
        legend.position = c(.5, -.22), legend.direction="horizontal",
        legend.background = element_rect(fill=alpha('lightgray', 0.4), color=NA),
        legend.key.width = unit(1, "cm"),
        legend.text = element_text(size=16))
What's worse, the problem seems to be intermittent - sometimes, the server shows the right font sizes; other times, the font sizes are shrunk. Because of this intermittency, I can't just change the font sizes on the server. I did this before, and when the problem waffled away, I had massive fonts in my ggplot outputs on my production server! Not ideal.
It's not completely browser-specific, because the same problem arises in Safari.
I've seen solutions to similar problems about font family that recommend using renderImage() rather than renderPlot(). But I'd rather not do that, as I'd eventually like to add an interactive hover tool to the plot, and I imagine that's not possible with an image.
I've also seen answers about screen size, but I don't understand how that could be causing this, as I'm working consistently on the same screen and same browser.
What could I be doing in my server settings, Shiny config, CSS, browser, etc. to cause this weird, on-again-off-again problem? I can share more details if useful.

