The Concept
First detect the total number of kernels in the image. Given the dark background, a simple binary threshold and an area filter (to filter out noise) will suffice as the processing, before passing the image into the cv2.findContours() method and getting the length of the results.
Next, use a color range to mask out the infested kernels. The program below uses an LAB color mask, with the lower range being np.array([0, 0, 150]), and the upper range being np.array([255, 255, 255]). This will not mask out the infested kernels completely, but using the area filter will allow us to filter them out based on their decreased area in the mask.
From Wikipedia's page on CIELAB color space:
The CIELAB color space, also referred to as Lab* , is a color space defined by the International Commission on Illumination (abbreviated CIE) in 1976.
Finally, we'll be able to draw on the contours of the good kernels, and calculate the percentage of infested kernels to total kernels.
The Code:
import cv2
import numpy as np

def large(cnt):
    return cv2.contourArea(cnt) > 5000

def get_contours(img):
    return cv2.findContours(img, cv2.RETR_EXTERNAL, cv2.CHAIN_APPROX_NONE)[0]

def get_mask(img):
    img_lab = cv2.cvtColor(img, cv2.COLOR_BGR2LAB)
    lower = np.array([0, 0, 150])
    upper = np.array([255, 255, 255])
    return cv2.inRange(img_lab, lower, upper)

img = cv2.imread("corn.jpg")
img_gray = cv2.cvtColor(img, cv2.COLOR_BGR2GRAY)
_, thresh = cv2.threshold(img_gray, 100, 255, cv2.THRESH_BINARY)
total = len(list(filter(large, get_contours(thresh))))

mask = get_mask(img)
contours = list(filter(large, map(cv2.convexHull, get_contours(mask))))
cv2.drawContours(img, contours, -1, (0, 255, 0), 3)

infested = total - len(contours)
print(f"Total Kernels: {total}")
print(f"Infested Kernels: {infested}")
print(f"Infested Percentage: {round(infested / total * 100)}%")

cv2.imshow("Result", cv2.resize(img, (700, 700)))
cv2.waitKey(0)
The Output:
Total Kernels: 70
Infested Kernels: 27
Infested Percentage: 39%
The Explanation
- Import the necessary libraries:
import cv2
import numpy as np
- Define a function,
large(), that will take in a contour and return True if the area of the contour is greater than 5000 (adjust this value accordingly when working with images of different sizes):
def large(cnt):
    return cv2.contourArea(cnt) > 5000
- Define a function,
get_contours(), that will take in a binary image and return the contours of the image:
def get_contours(img):
    return cv2.findContours(img, cv2.RETR_EXTERNAL, cv2.CHAIN_APPROX_NONE)[0]
- Define a function,
get_mask(), that will take in an image, convert it to LAB color space, and return the mask for the image with the lower range 0, 0, 150 and the upper range 255, 255, 255:
def get_mask(img):
    img_lab = cv2.cvtColor(img, cv2.COLOR_BGR2LAB)
    lower = np.array([0, 0, 150])
    upper = np.array([255, 255, 255])
    return cv2.inRange(img_lab, lower, upper)
- Read in the image file. To find the total number of kernels in the image, convert the image to grayscale, threshold it so that the background is masked out, and find the contours using the
get_contours() function we defined. Also, filter out any noise with the built-in filter() function, using the large() function we defined as the first argument. That way, we can use the built-in len() function to get the total number of kernels in the image:
img = cv2.imread("corn.jpg")
img_gray = cv2.cvtColor(img, cv2.COLOR_BGR2GRAY)
_, thresh = cv2.threshold(img_gray, 100, 255, cv2.THRESH_BINARY)
total = len(list(filter(large, get_contours(thresh))))
Resulting thresh for the image corn.jpg:

- Get the mask of the image using the
get_mask() image we defined, get the contours of the mask, and also filter out any noise using the large() function. With the filtered contours, call the cv2.drawContours() method to highlight the good kernels (purely for visualization):
mask = get_mask(img)
contours = list(filter(large, map(cv2.convexHull, get_contours(mask))))
cv2.drawContours(img, contours, -1, (0, 255, 0), 3)
Resulting mask for the image corn.jpg:
I ran the program again with some edits so that the contours would be drawn on the mask, for a better understanding of the filtering process:
- Finally, we can calculate the percentage of infested kernels to the total amount of kernels in the image, and
print the results:
infested = total - len(contours)
print(f"Total Kernels: {total}")
print(f"Infested Kernels: {infested}")
print(f"Infested Percentage: {round(infested / total * 100)}%")
Tools
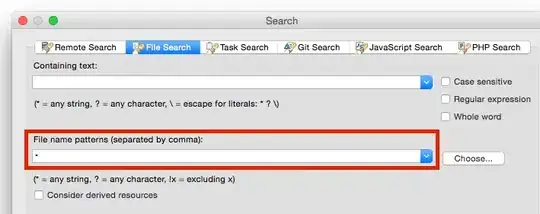
If you happen to have other images that you would like to apply the same algorithm to, but the shades of the other images are rather different, you can use OpenCV Trackbars to adjust the lower and upper bounds of the color mask (as well as any other value that might need tweaking). Here is a program that allows you to change the LAB ranges through trackbars, and shows the resulting images in real-time:
import cv2
import numpy as np

def large(cnt):
    return cv2.contourArea(cnt) > 5000

def get_contours(img):
    return cv2.findContours(img, cv2.RETR_EXTERNAL, cv2.CHAIN_APPROX_NONE)[0]

def get_mask(img, l_min, l_max, a_min, a_max, b_min, b_max):
    img_lab = cv2.cvtColor(img, cv2.COLOR_BGR2LAB)
    lower = np.array([l_min, a_min, b_min])
    upper = np.array([l_max, a_max, b_max])
    return cv2.inRange(img_lab, lower, upper)

def show(imgs, win="Image", scale=1):
    imgs = [cv2.cvtColor(img, cv2.COLOR_GRAY2BGR) if len(img.shape) == 2 else img for img in imgs]
    img_concat = np.concatenate(imgs, 1)
    h, w = img_concat.shape[:2]
    cv2.imshow(win, cv2.resize(img_concat, (int(w * scale), int(h * scale))))

def put_text(img, text, y):
    cv2.putText(img, text, (20, y), cv2.FONT_HERSHEY_COMPLEX, 2, (255, 128, 0), 4)

d = {"L min": (0, 255),
     "L max": (255, 255),
     "A min": (0, 255),
     "A max": (255, 255),
     "B min": (150, 255),
     "B max": (255, 255)}

cv2.namedWindow("Track Bars")
for i in d:
    cv2.createTrackbar(i, "Track Bars", *d[i], id)

img = cv2.imread("corn.jpg")
img_gray = cv2.cvtColor(img, cv2.COLOR_BGR2GRAY)
_, thresh = cv2.threshold(img_gray, 100, 255, cv2.THRESH_BINARY)
total = len(list(filter(large, get_contours(thresh))))
while True:
    img_copy = img.copy()
    mask = get_mask(img, *(cv2.getTrackbarPos(i, "Track Bars") for i in d))
    contours = list(filter(large, map(cv2.convexHull, get_contours(mask))))
    cv2.drawContours(img_copy, contours, -1, (0, 255, 0), 3)
    infested = total - len(contours)
    put_text(img_copy, f"Total Kernels: {total}", 50)
    put_text(img_copy, f"Infested Kernels: {infested}", 120)
    put_text(img_copy, f"Infested Percentage: {round(infested / total * 100)}%", 190)
    show([img_copy, mask], "Results", 0.3)
    if cv2.waitKey(1) & 0xFF == ord("q"):
        break
Demonstration of the program (speed x2):