I am a python user in the very early stage.
I have two data set of temperature over a specific location from the year 1850 to 2010 with one value of temperature for each month for this entire period. I am trying to create a table with these values in the below given format. T is my data.
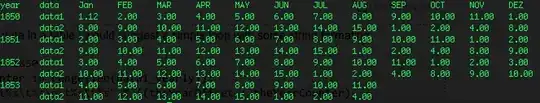
year data JAn FEB MAR APR MAY JUN JUL AUG SEP .......DEC.
1850 data1 t   t   t   t   t   t   t   t   t          t.
     data2 t   t   t   t   t   t   t   t   t          t.
'.
'.
'.
2010 data1 t   t   t   t   t   t   t   t  t           t.
I am sorry i cannnot post a picture of the table how i need. I am not allowed to post a picture. and i am not able to specify the shape of my table i need. so am posting a link of another sample table. its another data set. but i need to have two rows against the year. one for my data1 and one for my data 2.
Now what i have is the complete one series of data ranging from 1850 to 2010. I want to rewrite the two data sets in the above given format as a table. from the data i have sliced data1 and data 2 for each year. I know it is an easily accomplish able job through an office package, but i know that is not the way of programing. please some one help me in doing it.
Here is what i have now.
data1 = [t, t, t, t, t, t, t, t, t,..............................t]
data2 = [t, t, t, t, t, t, t, t, t,..............................t]

#This data1 and data2 is the list of data for the entire period from 1850-2010
#I sliced this data as
n = len(data1)
data1_yearly = [data1[i:i+12] for i in xrange(0,n,12)]
data2_yearly = [data2[i:i+12] for i in xrange(0,n,12)]
Now I have the values for both data1 and data2 sliced for each year. data1_yearly[0] gives me the value of the data for the year 1850 and further indexing will give me the data for all the period.
So from here starts my problem. How can I write this data as a table in the format I specified above. I am purely new to this language and so please don't consider this request a foolish one and kindly hlep me.