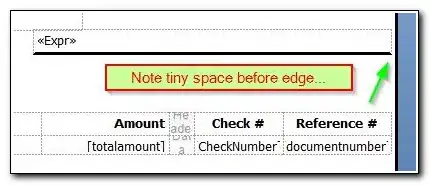
I have a lot of tables with climate observations in daily frequency. As you can see all columns of months have 31 days. I wanna organize this data correctly, excluding all false days and transform in a regular time series.
dput(head(data,31)):
structure(list(NA. = 1:31, JAN = c(NA_real_, NA_real_, NA_real_,
NA_real_, NA_real_, NA_real_, NA_real_, NA_real_, NA_real_, NA_real_,
NA_real_, NA_real_, NA_real_, NA_real_, NA_real_, NA_real_, NA_real_,
NA_real_, NA_real_, NA_real_, NA_real_, NA_real_, NA_real_, NA_real_,
NA_real_, NA_real_, NA_real_, NA_real_, NA_real_, NA_real_, NA_real_
), FEV = c(NA_real_, NA_real_, NA_real_, NA_real_, NA_real_,
NA_real_, NA_real_, NA_real_, NA_real_, NA_real_, NA_real_, NA_real_,
NA_real_, NA_real_, NA_real_, NA_real_, NA_real_, NA_real_, NA_real_,
NA_real_, NA_real_, NA_real_, NA_real_, NA_real_, NA_real_, NA_real_,
NA_real_, NA_real_, NA_real_, NA_real_, NA_real_), MAR = c(0,
0, 0, 0, 0, 0, 0, 0, 0, 0, 0, 0, 0, 0, 0, 0, 0, 0, 0, 0, 0, 0,
0, 0, 0, 0, 0, 0, 0, 12.5, 0), ABR = c(0, 0, 0, 0, 0, 0, 0, 0,
0, 0, 0, 1.9, 0, 0, 0, 0, 0, 0, 0, 0, 0, 0, 0, 0, 0, 0, 0, 0,
0, 0, NA), MAI = c(0, 0, 0, 0, 0, 0, 0, 0, 0, 0, 0, 0, 0, 0,
0, 0, 0, 0, 0, 0, 2.5, 0, 0, 0, 0, 0, 0, 1.8, 0, 0, 0), JUN = c(0,
0, 0, 0, 0, 3.4, 0, 0, 0, 0, 0, 0, 0, 0, 7, 0, 0, 0, 0, 0, 0,
0, 6.8, 2.4, 2.1, 0, 0, 0, 0, 0, NA), JUL = c(0, 0, 4.4, 0, 0,
15.4, 0, 0, 0, 0, 0, 0, 0, 0, 0, 2.2, 0, 1.3, 0, 0, 1.7, 0, 0,
0, 0, 0, 0, 0, 0, 0, 0), AGO = c(0, 0, 0, 0, 1.9, 0, 0, 0, 0,
0, 0, 0, 0, 0, 0, 0, 0, 0, 0, 0, 0, 0, 0, 3.1, 4, 2.6, 0, 0,
0, 0, 0), SET = c(0, 0, 0, 0, 0, 0, 0, 0, 0, 0, 0, 0, 0, 0, 0,
0, 0, 0, 0, 0, 0, 0, 0, 0, 0, 0, 0, 0, 0, 0, NA), OUT = c(0,
0, 0, 0, 0, 0, 0, 0, 0, 0, 0, 0, 0, 0, 0, 0, 0, 0, 0, 0, 0, 0,
0, 0, 0, 0, 0, 0, 0, 0, 0), NOV = c(0, 0, 0, 0, 0, 0, 0, 0, 0,
0, 0, 0, 0, 0, 0, 0, 0, 0, 0, 0, 0, 0, 17.7, 0, 0, 0, 0, 0, 0,
0, NA), DEZ = c(0, 0, 0, 0, 0, 0, 0, 0, 0, 0, 0, 0, 0, 0, 0,
0, 0, 0, 0, 0, 0, 0, 0, 0, 0, 0, 0, 0, 0, 0, 0)), row.names = c(NA,
31L), class = "data.frame")
I wanna like this example:
original data: https://www.dropbox.com/s/0xizr6fhbriieds/data.csv?dl=0
Please, anyone help-me. Is for my scientific initiation.

