3

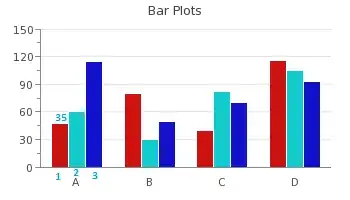
I am plotting a bargraph using jpgraph library but I am finding a way to do few changes such as: (a) X-axis already has texts A, B, C, D. How do I add another set of texts, for example Plot A has 3 bars, and I want to label each bar as 1, 2, 3 as given

(b) How do I write values of each bar on top of the bar?

<?php // content="text/plain; charset=utf-8"
require_once ('jpgraph/jpgraph.php');
require_once ('jpgraph/jpgraph_bar.php');

$data1y=array(47,80,40,116);
$data2y=array(61,30,82,105);
$data3y=array(115,50,70,93);


// Create the graph. These two calls are always required
$graph = new Graph(350,200,'auto');
$graph->SetScale("textlin");

$theme_class=new UniversalTheme;
$graph->SetTheme($theme_class);

$graph->yaxis->SetTickPositions(array(0,30,60,90,120,150), array(15,45,75,105,135));
$graph->SetBox(false);

$graph->ygrid->SetFill(false);
$graph->xaxis->SetTickLabels(array('A','B','C','D'));
$graph->yaxis->HideLine(false);
$graph->yaxis->HideTicks(false,false);

// Create the bar plots
$b1plot = new BarPlot($data1y);
$b2plot = new BarPlot($data2y);
$b3plot = new BarPlot($data3y);

// Create the grouped bar plot
$gbplot = new GroupBarPlot(array($b1plot,$b2plot,$b3plot));
// ...and add it to the graPH
$graph->Add($gbplot);


$b1plot->SetColor("white");
$b1plot->SetFillColor("#cc1111");

$b2plot->SetColor("white");
$b2plot->SetFillColor("#11cccc");

$b3plot->SetColor("white");
$b3plot->SetFillColor("#1111cc");

$graph->title->Set("Bar Plots");

// Display the graph
$graph->Stroke();
?>

Barplot

EDIT: I found a solution for (b) by adding at the end of the code:

$b1plot->value->Show();
$b2plot->value->Show();
$b3plot->value->Show();

I still have not found solution for (a).
  • For a), I guess [a legend](https://jpgraph.net/download/manuals/chunkhtml/ch14s04.html) is not what you are after? – Don't Panic Apr 26 '20 at 23:53

2 Answers2

4

You can set the legend on each bar_plot by ->legend = '1';

Then you can set the legend layout to 1 column and add right margin to the graph so the legends has space.

Here is my working code:

$data1y=array(47,80,40,116);
$data2y=array(61,30,82,105);
$data3y=array(115,50,70,93);


// Create the graph. These two calls are always required
$graph = new Graph(350,200,'auto');
$graph->SetScale("textlin");

$theme_class=new UniversalTheme;
$graph->SetTheme($theme_class);

$graph->yaxis->SetTickPositions(array(0,30,60,90,120,150, 180, 210), array(15,45,75,105,135));
$graph->SetBox(false);

$graph->ygrid->SetFill(false);
$graph->xaxis->SetTickLabels(array('A','B','C','D'));
$graph->yaxis->HideLine(false);
$graph->yaxis->HideTicks(false,false);

// Create the bar plots
$b1plot = new BarPlot($data1y);
$b2plot = new BarPlot($data2y);
$b3plot = new BarPlot($data3y);

// Create the grouped bar plot
$gbplot = new GroupBarPlot(array($b1plot,$b2plot,$b3plot));
// ...and add it to the graPH
$graph->Add($gbplot);


$b1plot->SetColor("white");
$b1plot->SetFillColor("#cc1111");
$b1plot->value->Show();
$b1plot->legend = '1';

$b2plot->SetColor("white");
$b2plot->SetFillColor("#11cccc");
$b2plot->value->Show();
$b2plot->legend = '2';

$b3plot->SetColor("white");
$b3plot->SetFillColor("#1111cc");
$b3plot->value->Show();
$b3plot->legend = '3';


$graph->title->Set("Bar Plots");

$graph->SetMargin(40,80,40,40);
$graph->legend->Pos(0.05,0.5, 'right', 'center');
$graph->legend->SetColumns(1);

// Display the graph
$graph->Stroke();

Output: enter image description here

Diogo Gomes
  • 2,135
  • 16
  • 13
0

You can get the values on top of the bar doing so:

$b1plot->value->Show();<br>
$b1plot->value->SetFormat( "1" );<br>
$b2plot->value->Show();<br>
$b2plot->value->SetFormat( "2" );<br>
$b3plot->value->Show();<br>
$b3plot->value->SetFormat( "3" );<br>

You can also set the position of the text to the center of the bar:

$b1plot->SetValuePos( "center" );<br>
$b2plot->SetValuePos( "center" );<br>
$b3plot->SetValuePos( "center" );<br>
Dula
  • 1,276
  • 5
  • 14
  • 23
  • 1
    The answer is clear and organized and will prove helpful to future users. I have no criticism of your answer, but rather an improvement recommendation: it would be helpful if you follow your sample code with a graphic of the barchart with the features reflecting your recommendations, in keeping with the original question and the answer by @user:5215806 (Diogo Gomes). This will help future users to know what to expect from your recommendations. This is no criticism of your answer, just an improvement. – quinny Nov 25 '21 at 10:20