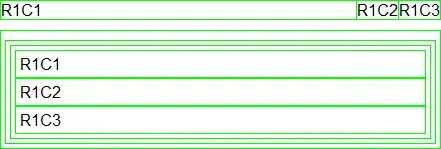
This code works and the pivot table is drawn but the treemap is huge and I need it to render to about 50% of the current size, 500px would be fine for now. It seems to ignore the size settings. One pivot table overlaps the other when drawn.
output$pivot3 <- renderRpivotTable({
rpivotTable(data = dotsData,
rows="county",
cols="shortBreath",
width="500px",
height="500px",
aggregatorName = "Count",
aggregators = list(
Percentage = htmlwidgets::JS('$.pivotUtilities.aggregators["Count as Fraction of Columns"]'),
Count = htmlwidgets::JS('$.pivotUtilities.aggregators["Count"]')),
sorters="function(attr) {
                          var sortAs = $.pivotUtilities.sortAs;
                          if (attr == \"county\") {
                               return sortAs;
                          }
                        }")
})

