I am working on Windows. I just want to input an array and get the cdf of the array.
Asked
Active
Viewed 8,907 times
1
-
Do you have matplotlib and numpy/scipy available? – Björn Pollex May 27 '11 at 08:49
-
@Bruce: Also, what do you mean by *cdf of the array*? A cdf has to be calculated with respect to a certain distribution. – Björn Pollex May 27 '11 at 09:25
-
@Space_C0wb0y: We can calculate probabilities assuming X contains outcome of an experiment. e.g. X = [1,3,4,5,7,8,10]. P(X < 1) = 0, P(X<5) = 3/7, P(X<11) = 1 etc. So we can plot P(X) for some known points in the range(X). – Bruce May 28 '11 at 12:02
-
@Bruce: What about `P(X<6)`? Is your data always discrete? Could you perform a density estimate, e.g. using `scipy.stats.gaussian_kde`? – Björn Pollex May 28 '11 at 13:04
-
@Space_C0wb0y: 4/7, yes my data is always discrete. – Bruce May 28 '11 at 16:56
-
@Bruce: I modified my answer, it should solve your problem. – Björn Pollex May 28 '11 at 17:22
-
possible duplicate of [How to plot empirical cdf in matplotlib in Python?](http://stackoverflow.com/questions/3209362/how-to-plot-empirical-cdf-in-matplotlib-in-python) – Dave Feb 04 '15 at 15:33
2 Answers
5
First, you could implement the CDF like this:
from bisect import bisect_left

class discrete_cdf:
    def __init__(self, data):
        self._data = data # must be sorted
        self._data_len = float(len(data))

    def __call__(self, point):
        return (len(self._data[:bisect_left(self._data, point)]) /
                self._data_len)
Using the above class, you can plot it like this:
from scipy.stats import norm
import matplotlib.pyplot as plt

cdf = discrete_cdf(your_data)
xvalues = range(0, max(your_data))
yvalues = [cdf(point) for point in xvalues]
plt.plot(xvalues, yvalues)
Edit: An arange doesn't make sense there, the cdf will always be the same for all points between x and x+1.
Björn Pollex
- 75,346
- 28
- 201
- 283
-
Nice solution. You can simplify `len(self._data[:bisect_left(self._data, point)])` to `bisect_left(self._data, point)`, since the slice already specifies the length. Perhaps `bisect_right` would also be better, since the CDF is for points where P(X <= x). – Lars Yencken Mar 14 '12 at 06:08
-
You should keep in mind that self is also included in a function call, therefore when you call "discrete_cdf(your_data)" you are actually doing "discrete_cdf(self, your_data)". So it is better to include "self" in your functions "def __init__(self, data):" – Raein Hashemi Jul 27 '18 at 17:10
-
@RaeinHashemi It is not just better, but in fact required - the code as shown was incorrect, thanks for pointing it out! – Björn Pollex Jul 29 '18 at 14:45
-
The class gives me a syntax error - something missing between `return (len(self._data[:bisect_left(self._data, point)])` and `self._data_len)` in the last two lines of the class? – ru111 Mar 12 '19 at 17:53
-
@ru111 Yes, there should be a division (`/`) there, this got lost in some edit. Thanks for pointing that out! – Björn Pollex Mar 14 '19 at 12:24
2
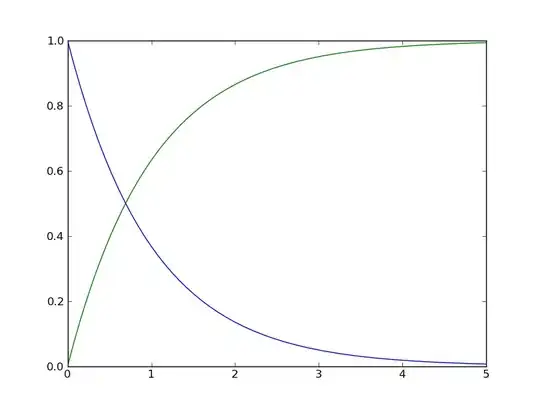
Is this what you're after? I have provided a function for approximating the cdf and plotted it. (Assuming you want to input a pdf array with y-values)
import matplotlib.pyplot as plt
from math import exp

xmin=0
xmax=5
steps=1000
stepsize=float(xmax-xmin)/float(steps)
xpoints=[i*stepsize for i in range(int(xmin/stepsize),int(xmax/stepsize))]
print xpoints,int(xmin/stepsize),int(xmax/stepsize)

ypoints=map(lambda x: exp(-x),xpoints)

def get_cdf(pdf_array):
    ans=[0]
    for i in range(0,len(pdf_array)-1):
        ans.append(ans[i]+(pdf_array[i]+pdf_array[i+1])/2.0*stepsize)
    return ans

cdfypoints=get_cdf(ypoints)

plt.plot(xpoints,ypoints)
plt.plot(xpoints,cdfypoints)
plt.show()
Rusty Rob
- 16,489
- 8
- 100
- 116