So from the dataframe, you'll need to select the rows from a list of the states you want: ['Michigan', 'Wisconsin']
I also figured you would probably want a legend or some way to differentiate one point from the other. To do this, we create a colormap assigning a different color to each state. This way the code is generalizable for more than those two states.
import pandas as pd
import numpy as np
import matplotlib.pyplot as plt
import matplotlib.cm as cm
import matplotlib.colors as colors
# generate a random df with the relevant rows, columns to your actual df
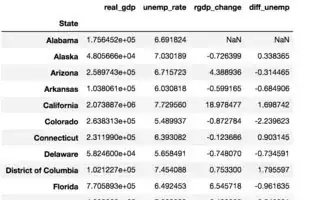
df = pd.DataFrame({'State':['Alabama', 'Alaska', 'Michigan', 'Wisconsin'], 'real_gdp':[1.75*10**5, 4.81*10**4, 2.59*10**5, 1.04*10**5],
'rgdp_change': [-0.4, 0.5, 0.4, -0.5], 'diff_unemp': [-1.3, 0.4, 0.5, -11]})
fig, ax = plt.subplots()
states = ['Michigan', 'Wisconsin']
colormap = cm.viridis
colorlist = [colors.rgb2hex(colormap(i)) for i in np.linspace(0, 0.9, len(states))]
for i,c in enumerate(colorlist):
x = df.loc[df["State"].isin(['Michigan', 'Wisconsin'])].rgdp_change.values[i]
y = df.loc[df["State"].isin(['Michigan', 'Wisconsin'])].diff_unemp.values[i]
legend_label = states[i]
ax.scatter(x, y, label=legend_label, s=50, linewidth=0.1, c=c)
ax.legend()
plt.show()