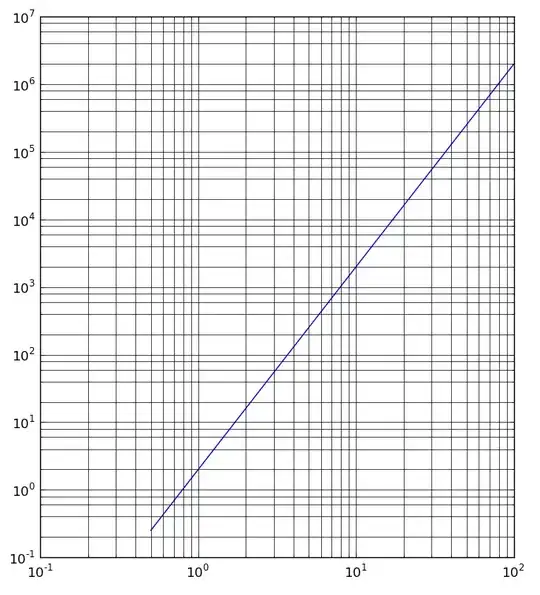
I used python's matplotlib to plot my data.
I call the numpy array before plotting as Array1 and it looks like this:
After I called plt.pcolormesh(t,f,Array1), it produced an Image that looks like this:
Then I read the image by calling imread('Image'). I got Array2 that looks like this:
I'm confused by these two arrays, and I'm wondering how did plt.pcolormesh mapped Array1 to Array2 so I can reverse the process and get my Array1 back from Array2.


