-1

I have a large data set that I want to represent with a network graph using igraph. I just don't understand how to get the colors right. Is it possible to get an igraph plot with edge having the same color as vertex color? I my example below, I would like to color vertex and edges according to the status 'sampled' or 'unsampled'. An other problem is that all the edge do not appear on the igraph, and I don't understand why

My code so far is:

d <- data.frame(individual=c(1:10), mother_id = c(0,0,0,0,0,1,3,7,6,7), father_id = c(0,0,0,0,0,4,1,6,7,6) , generation = c(0,0,0,0,0,1,1,2,2,2), status=c("sampled","unsampled","unsampled","sampled",'sampled',"sampled","unsampled","unsampled","sampled",'sampled'))

#Just some settings for layout plot
g <- d$generation
n <- nrow(d)
pos <- matrix(data = NA, nrow = n, ncol = 2)
pos[, 2] <- max(g) - g
pos[, 1] <- order(g, partial = order(d$individual, decreasing = TRUE)) - cumsum(c(0, table(g)))[g + 1]

#Plotting the igraph
G <- graph_from_data_frame(d)
plot(G, rescale = T, vertex.label = d$individual, layout = pos,
edge.arrow.mode = "-",
vertex.color = d$status,
edge.color = d$status,
asp = 0.35)

My question is somewhat similar to this question, but I would like to do it with igraph package. Ggraph node color to match edge color

Thanks for your help
Ehones
  • 27
  • 3
  • generally speaking, an edge can connect two nodes of different colors. How do you chose the color in such a case? Or is this case always excluded in your data? – desval May 04 '20 at 16:17
  • The graph represent different generations of a genealogical tree. The first generation is the first layer, the second generation is the second layer, etc. The idea is to color edges with the same color of the upper node. Thx for your help – Ehones May 04 '20 at 16:29
  • if you organize the data following the example below it will be really easy to match the colors. I am not sure where you want the edges to be. Is the graph directed or undirected? Does id 6 receive links from both 1 and 4? – desval May 04 '20 at 17:58

1 Answers1

2

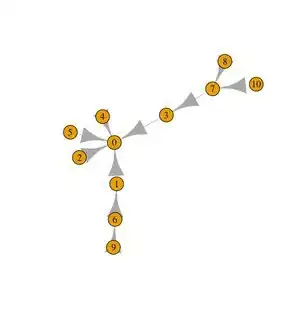
if you plot(G) you will see that the graph from data frame object is not what you expect, most likely. That is why you dont see all edges (i.e the column father_id is not used at all).

By default igraph takes the first column as "from" and the second one as "to". That is why you see 1to0, 2to0 and so on.

enter image description here

You can fix this by passing in two objects, one with the edges and their attributes, and one with the nodes and their attributes. It is not so clear to me where the edges should be. However, your code should look something like this:

dd <- read.table(text = "
from to type
1 6 A
3 7 B
7 8 A
6 9 B
7 10 A
4 6 B
1 7 A
6 8 B
7 9 B
6 10 A ", header=T )

nodes <- data.frame(id=unique(c(dd$from, dd$to)) )
nodes$type <- sample(LETTERS[1:2], 8, replace = T  )
nodes$x <- c(8,3,5,7,1,2,4,10) # this if for the layout
nodes$y <- c(1, 2, 4, 5, 6, 8, 5, 7)

    nodes
  id type  x y
1  1    B  8 1
2  3    A  3 2
3  7    B  5 4
4  6    A  7 5
5  4    A  1 6
6  8    B  2 8
7  9    A  4 5
8 10    A 10 7

G <- graph_from_data_frame(dd, vertices = nodes ) # directed T or F?

V(G)$color <- ifelse( V(G)$type == "A", "pink", "skyblue")
E(G)$color <- ifelse( E(G)$type == "A", "pink", "skyblue")

edge_attr(G)
vertex_attr(G)
plot(G)

enter image description here

desval
  • 2,345
  • 2
  • 16
  • 23