1

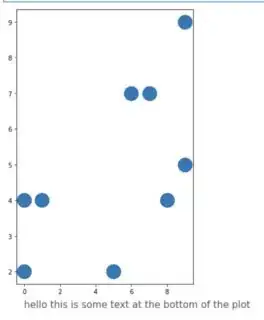
I would like to be able to add footnote text similar to the following in matplotlib:

enter image description here

The following code will create a plot with similar text

import matplotlib.pyplot as plt
import numpy as np
import pandas as pd


fig, ax = plt.subplots(figsize = (5, 8))
n = 10
np.random.seed(1)
_ = ax.scatter(np.random.randint(0, 10, n), np.random.randint(0, 10, n), s=500)
x = 0
y = 1
_ = ax.text(
    x, y, "hello this is some text at the bottom of the plot", fontsize=15, color="#555"
)

Which looks as:

enter image description here

However, if the data changes then the above won't adjust, such as:

import matplotlib.pyplot as plt
import numpy as np
import pandas as pd


fig, ax = plt.subplots(figsize=(5, 8))

n = 10
np.random.seed(2)
_ = ax.scatter(np.random.randint(0, 10, n), np.random.randint(0, 10, n), s=500)
x = 0
y = 1
_ = ax.text(
    x, y, "hello this is some text at the bottom of the plot", fontsize=15, color="#555"
)

enter image description here

I have seen this question/answer, and this just says how to plot text at a particular x,y coordinate. I specifically want to be able to set a footnote though, not plot at a particular x,y, so the solution should be dynamic.

Also, use of the OOP interface is preferred as mentioned in the docs.

Note - there seems to be issues with the current suggestion when using fig.tight_layout()
baxx
  • 3,956
  • 6
  • 37
  • 75
  • As a sidenote, if you don't need the return values of `ax.scatter` and `ax.text`, you don't need to assign them to a variable at all. – mapf May 04 '20 at 21:56
  • @mapf i have added imports for you - also - i know i don't need them, I just assign them so i don't get output in jupyterlab – baxx May 04 '20 at 22:00

1 Answers1

2

You should try plotting the text relative to the subplot and not relative to the points in the subplot using transform=ax.transAxes. You should also set the alignment so that the text starts based on the location you want. The can play around with the point location.

import matplotlib.pyplot as plt
import numpy as np
import pandas as pd


fig, ax = plt.subplots(figsize=(5, 8))

n = 10
np.random.seed(2)
_ = ax.scatter(np.random.randint(0, 10, n), np.random.randint(0, 10, n), s=500)
x = 0
y = -.07
ax.text(x, y, "hello this is some text at the bottom of the plot", fontsize=15, 
        horizontalalignment='left',verticalalignment='top', transform=ax.transAxes)

plt.show()

enter image description here

BenT
  • 3,172
  • 3
  • 18
  • 38
  • this seems to have problems when using `fig.tight_layout()` – baxx May 12 '20 at 15:56
  • Do you need `fig.tight_layout()`? You are adjusting the axis so the numbers you choose don't have the same meaning. See https://matplotlib.org/3.1.1/api/tight_layout_api.html – BenT May 12 '20 at 16:34
  • Do you change the layout before or after you plot the text? – BenT May 12 '20 at 16:36