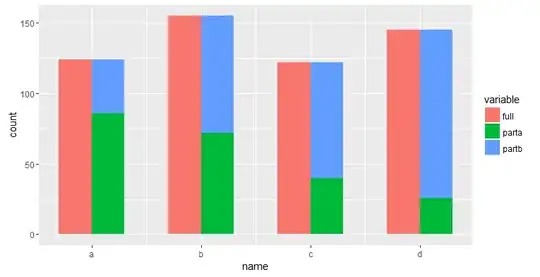
I am trying to reproduce this plot with ggplot2 :

From what I understood you can call it a histogram with linear color gradient
I stuck on this linear color gradient, I can't figure how to reproduce it within each columns.
I found one work around on another post here :Trying to apply color gradient on histogram in ggplot
But it is quite an old one and does not look well with my data, also it is more a "categorical coloring" than a "gradient coloring".
I found also this one : Plot background colour in gradient but it only applies the gradient on the plot background and not in the columns.
This could be tested using the iris dataset :
ggplot(iris, aes(x=Species, fill=Petal.Width)) +
    geom_histogram(stat = "count")
Where the Petal.Width values of each Species would be used as a coloring gradient for each columns of the histogram with a color legend as in the example plot.
Any help is welcome !