Hi, I'm using GeoData and Now I really want to get a contour to array.
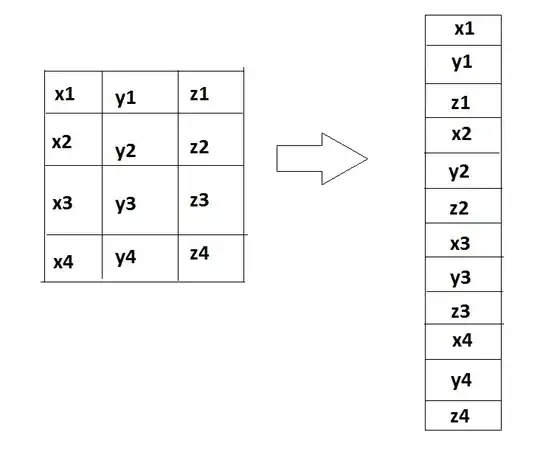
I have 3ea array of y,x,z and I draw a contour by plt.contour(yyy2,xxx2,zzz2,levels=[0.5])
the contour is drawn by Z=0.5
Now, I want to get this contour line to arrays. (some samples of [yy, xx])
For example....array[[127.7,37.7],[127.6,37.6],[127.5,37.5]....,[127.1,37.1]] is what I wanted.
Any possible method is exist? Thank you.
