0

I am relatively new to programming , and I am trying to execute my piece of code in order to plot the values

My code:

import matplotlib.pyplot as plt
import pandas as pd

# set directory
df = pd.read_excel('Angle difference plot.xlsx', 'Sheet1')


# set plot
plt.plot(df['Angle'], df['RE Angle'])

# set label
plt.xlabel('calculated angle')
plt.ylabel('ground truth)')   
plt.title('angle accuracy plot')
plt.legend()

plt.show

When I execute the above code , I get the following error :

 return self._engine.get_loc(key)
  File "pandas\_libs\index.pyx", line 111, in pandas._libs.index.IndexEngine.get_loc
  File "pandas\_libs\index.pyx", line 138, in pandas._libs.index.IndexEngine.get_loc
  File "pandas\_libs\hashtable_class_helper.pxi", line 1619, in pandas._libs.hashtable.PyObjectHashTable.get_item
  File "pandas\_libs\hashtable_class_helper.pxi", line 1627, in pandas._libs.hashtable.PyObjectHashTable.get_item
KeyError: 'Angle'

Can someone explain me why I am seeing this error ?

My excel file looks like this :
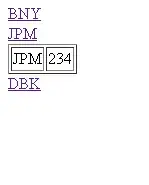
enter image description here

Any help is very much appreciated

Tom Carrick
  • 6,349
  • 13
  • 54
  • 78
  • 1
    Please [provide a reproducible copy of the DataFrame with `df.to_clipboard(sep=',')`](https://stackoverflow.com/questions/52413246/how-to-provide-a-copy-of-your-dataframe-with-to-clipboard). [Stack Overflow Discourages Screenshots](https://meta.stackoverflow.com/questions/303812/discourage-screenshots-of-code-and-or-errors). It is likely the question will be down-voted. You are discouraging assistance because no one wants to retype your data or code, and screenshots are often illegible. – Trenton McKinney Jun 14 '20 at 03:06
  • Please do follow @Trenton's guidelines as they will be helpful in solving your problem. Also check df.columns output and see if the "Angle" is in that. Make sure to check the trailing and leading spaces – HArdRe537 Jun 14 '20 at 03:09
  • In this case, the screenshot kind of helped. It does look like there is an additional space in the column header ` Angle`. – Ji Wei Jun 14 '20 at 03:34

3 Answers3

1

Fix the column names

import pandas as pd
import matplotlib.pyplot as plt

# set directory
df = pd.read_excel('Angle difference plot.xlsx', 'Sheet1')

# clear whitespace from the beginning and end of the column names
df.columns = df.columns.str.strip()

# plot
plt.plot('Angle', 'RE Angle', data=df)
Trenton McKinney
  • 56,955
  • 33
  • 144
  • 158
  • Yes , you are correct . I have the spaces in the beginning and towards the end of the trace . After fixing that , my code works as expected . Thanks for the catch . Very much appreciated ! – Phani Ram Sunku Jun 14 '20 at 12:20
0

pls try this,

    plt.plot(df[df.columns[0]], df[df.columns[1]])
NANDHA KUMAR
  • 465
  • 4
  • 11
-1

I think you are wrong in this line: plt.show, it should be plt.show().

This code runs well:

import pandas as pd
import matplotlib.pyplot as plt

xl = pd.ExcelFile('d:/Python2020/20200614_1_tempexcelfile.xls')
# get the first sheet as an object
df = pd.read_excel(xl, 0, header=None)
# print(df.head())
# print(df.iloc[1:, 0])

# set plot
# plt.plot(df[df.columns[0]], df[df.columns[1]])
plt.plot(df.iloc[1:, 0], df.iloc[1:, 1])

# set label
plt.xlabel('calculated angle')
plt.ylabel('ground truth)')
plt.title('angle accuracy plot')
plt.legend()
plt.show()
protoproto
  • 2,081
  • 1
  • 13
  • 13