I'm putting together some matplotlib charts but I'd like to put proper data source attribution in a text box just below the x-axis. I've looked at a few examples using text() but can't get any to work.
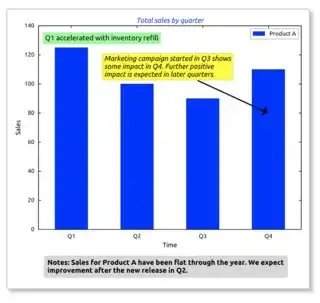
I'm looking to add something like the text in the grey box in this image (taken from http://www.futurile.net/2016/03/01/text-handling-in-matplotlib/, which frustratingly doesn't include the code to produce that plot!):
I feel like this must be a relatively common thing, but I'm a bit stumped. How do I add that text using matplotlib?

