3

There is a Java Struts application running on Tomcat, that have some memory errors. Sometimes it becomes slowly and hoard all of the memory of Tomcat, until it crashes.

I know how to find and repair "normal code errors", using tests, debugging, etc, but I don't know how to deal with memory errors (How can I reproduce? How can I test? What are the places of code where is more common create a memory error? ).

In one question: Where can I start? Thanks

EDIT:

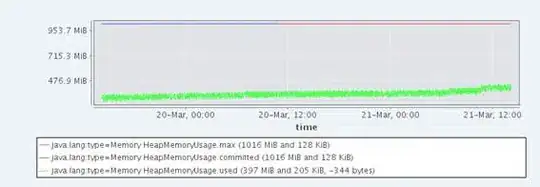
A snapshot sended by the IT Department (I haven't direct access to the production application)
enter image description here

Dr. No
  • 1,306
  • 5
  • 28
  • 57
  • 1
    How does it crash? Any thread dump? Exception stack trace? – Op De Cirkel Jun 06 '11 at 06:36
  • I added a snapshot of the memory usage. They restart the server before any Exception stack trace. – Dr. No Jun 07 '11 at 07:38
  • Questions that ask "where do I start?" are typically too broad and are not a good fit for this site. People have their own method for approaching the problem and because of this there cannot be a _correct_ answer. Give a good read over [Where to Start](//softwareengineering.meta.stackexchange.com/a/6367) and [edit] your post. – double-beep Jun 06 '19 at 11:27

5 Answers5

5

Use one of the many "profilers". They hook into the JVM and can tell you things like how many new objects are being created per second, and what type they are etc.

Here's just one of many: http://www.ej-technologies.com/products/jprofiler/overview.html I've used this one and it's OK.

Bohemian
  • 412,405
  • 93
  • 575
  • 722
1

http://kohlerm.blogspot.com/ It is quite good intro how to find memory leaks using eclipse memory analyzer.

If you prefer video tutorials, try youtube, although it is android specific it is very informative.

bbaja42
  • 2,099
  • 18
  • 34
0

If your application becomes slowly you could create a heap dump and compare it to another heap dump create when the system is in a healthy condition. Look for differences in larger data structures.

stacker
  • 68,052
  • 28
  • 140
  • 210
0

You should run it under profiler (jprofile or yourkit, for example) for some time and see for memory/resource usage. Also try to make thread dumps.

dbf
  • 6,399
  • 2
  • 38
  • 65
0

There are couple of options profiler is one of them, another is to dump java heap to a file and analyze it with a special tool (i.e. IBM jvm provides a very cool tool called Memory Analizer that presents very detailed report of allocated memory in the time of jvm crash - http://www.ibm.com/developerworks/java/jdk/tools/memoryanalyzer/). 3rd option is to start your server with jmx server enabled and connect to it via JConsole with this approach you would be able to monitor memory ussage/allocation in the runtime. JConsole is provided with standard sun jdk under bin directory (here u may find how to connect to tomcat via jconsole - Connecting remote tomcat JMX instance using jConsole)

Community
  • 1
  • 1
Marcin Michalski
  • 1,266
  • 13
  • 17