I have data tables (d1 and d2) which I would like to print side by side or on top of each other in latex with their own individual titles. Is it possible to do that directly with xtable()? The two tables should be distinct, i.e. we could call them Table x(a) and Table x(b), but they should be either adjacent, or stacked.
Asked
Active
Viewed 1.2k times
8
Richard Herron
- 9,760
- 12
- 69
- 116
user702432
- 11,898
- 21
- 55
- 70
-
As one table? Then `xtable(rbind(d1,d2))` or `xtable(cbind(d1,d2))` should be fine right? – Sacha Epskamp Jun 07 '11 at 09:58
-
If you would like to keep the tables separate as Xa and Xb, then this becomes more of a latex labelling question. One of the moderators here should be able to migrate your question. – Richard Herron Jun 07 '11 at 11:24
-
@SachaEpskamp `rbind` only works if both tables have the same `ncol` (or for `cbind` / `nrow`). – David LeBauer Jul 20 '12 at 20:24
2 Answers
16
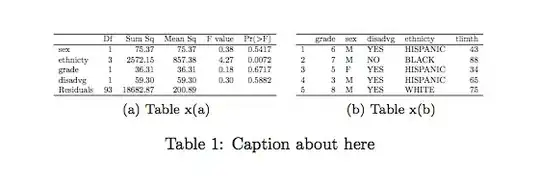
I would recommend saving the results as two separate tables in different files (see the file= option to print.xtable()), and then input them into your LaTeX document with any command you find appropriate for your layout (tabular, subfloat, minipage, etc.). This is what I do in general, although I generally rely on LaTeX facilities in the Hmisc package. Should you want only to print them as a standalone PDF, use the standalone class for your document.
So, here is an example:
data(tli)
fm1 <- aov(tlimth ~ sex + ethnicty + grade + disadvg, data=tli)
print(xtable(fm1), file="ta.tex", floating=FALSE)
print(xtable(head(tli, n=5)), file="tb.tex", floating=FALSE)
then, a quick tex wrapper (compile with pdflatex):
\documentclass{article}
\usepackage{subfig}
\usepackage{graphicx}

\begin{document}

\begin{table}[ht]
\centering
\subfloat[Table x(a)]{\label{tab:tab1a}\scalebox{.5}{\input{./ta}}}\quad
\subfloat[Table x(b)]{\label{tab:tab1b}\scalebox{.5}{\input{./tb}}}
\caption{Caption about here}
\label{tab:tab1}
\end{table}

\end{document}
Here is the result:
Remove the \scalebox command for default (stacked) layout, unless they are narrow enough to fit at their default size, as noted by @David.

chl
- 27,771
- 5
- 51
- 71
-
@chi removing `\scalebox` does not stack tables if they are narrow enough to fit at their default size. – David LeBauer Jul 20 '12 at 20:25
-
10
See Alan Munn's answer to a similar question on tex.stackexchange.com.
\documentclass{article}
\usepackage[utf8]{inputenc}
\usepackage{booktabs}
\usepackage{caption}
\title{Side-by-side xtables}
\author{}
\date{}
\begin{document}
\maketitle
First some R code to create some data.
<<>>=
myData <- matrix(c(19,89,23,23,74,44,16,39,67),ncol=3,byrow=TRUE)
colnames(myData) <- c("A","B","C")
rownames(myData) <- c("1","2","3")
myData2 <- myData * 2
@

Now we place the data in two side-by-side tables:

\begin{table}[htb]
\begin{minipage}{.45\textwidth}
\centering
<<echo=FALSE,results=tex>>=
library("xtable")
print(xtable(myData),
  floating=FALSE,
  hline.after=NULL,
  add.to.row=list(pos=list(-1,0, nrow(myData)),
  command=c('\\toprule\n','\\midrule\n','\\bottomrule\n')))
@
\captionof{table}{The first table}
\end{minipage}
\begin{minipage}{.45\textwidth}
\centering
<<echo=FALSE,results=tex>>=
print(xtable(myData2),
  floating=FALSE,
  hline.after=NULL,
  add.to.row=list(pos=list(-1,0, nrow(myData2)),
  command=c('\\toprule\n','\\midrule\n','\\bottomrule\n')))
@
\captionof{table}{The second table}
\end{minipage}
\end{table}
\end{document}
Community
- 1
- 1
MYaseen208
- 22,666
- 37
- 165
- 309