6

How do you position a text outside a plot in mathematica? A quick google search will lead you to

http://reference.wolfram.com/mathematica/howto/AddTextOutsideThePlotArea.html

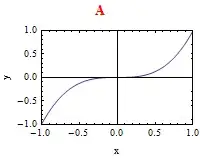
This is not enough since you want to achieve this with code. A simple example of placing text in mathematica is the following:

    Show[ 
     Plot[x^3, {x, -1, 1},
      Frame -> True, 
      ImageSize -> Medium, 
      FrameLabel -> {"x", "y"},
      PlotRange -> {{-1, 1}, {-1, 1}}
      ],
     Graphics[
      Text[Style["A", Bold, 14, Red], {.5, .5}]]
     ]

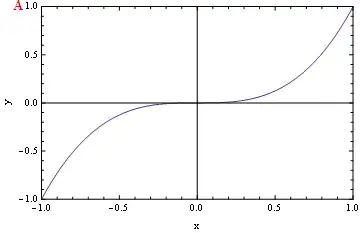
This places the letter A at the point (.5, .5) relative to the plot. Is there a way of placing text relative to the size of image? Everything is done in the plot coordinates as far as I know. The temporary solution I have is to set the option PlotRangeClipping to False and set the text by giving the right coordinates.

Show[
    Plot[
        x^3, {x, -1, 1}, 
        Frame -> True, 
        ImageSize -> Medium, 
        FrameLabel -> {"x", "y"}, 
        PlotRange -> {{-1, 1}, {-1, 1}}
    ],
    Graphics[
        Text[
            Style["A", Bold, 14, Red], 
            {-1.2, 1}
        ]
    ],
    PlotRangeClipping -> False
]

currentsolution

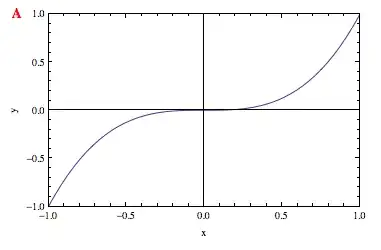
A disadvantage of this method is that if we change the range of the plot then we need to recalculate the coordinates of the text in order to keep it where we want it (relative to the whole image).

EDIT:

Try to position the Text A outside the plot.

Framed[
    Show[
        Graphics[
            {Orange, Disk[{0, 0}, 3.5]}, 
            Frame -> True, 
            PlotRange -> {{-3, 3}, {-3, 3}}, 
            PlotRangeClipping -> True, 
            FrameLabel -> {"x", "y"}
        ], 
        Graphics[
            Text[
                Style["A", Bold, 14], 
                ImageScaled[{.1, .95}]
            ]
        ]
    ]
]

enter image description here

EDIT:

In order to find another solution to this problem I started another post which gave me ideas to overcome a problem that belisarius solution had: Exporting the final figure to pdf was a rasterized version of the figure. Check my other post here for the solution.
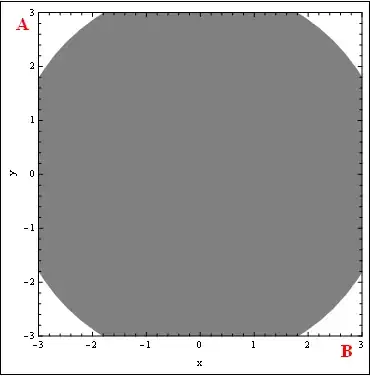
FINAL EDIT?

Since the image links are gone and the link in the previous edit has been modified I decided to update the images and include a modified solution of Simon's answer.

The idea is to create a mask and include the mask before drawing the labels. In this way we are creating our own plotRangeClipping.

mask2D = Graphics[{Gray,
    Polygon[{
        ImageScaled[{-0.5, -0.5}],
        ImageScaled[{-0.5, 1.5}],
        ImageScaled[{1.5, 1.5}],
        ImageScaled[{1.5, -0.5}],
        ImageScaled[{-0.5, -0.5}],
        Scaled[{0, 0}],
        Scaled[{1, 0}],
        Scaled[{1, 1}],
        Scaled[{0, 1}],
        Scaled[{0, 0}],
        ImageScaled[{-0.5, -0.5}]
    }]
}];

In some cases using ImageScaled of {1,1} is not enough to clip the main image. For this reason I have given more coverage by using 1.5 and -0.5. Now we can draw the image with label as follows:

Framed@Show[
    Graphics[
        {
            Orange,
            Disk[{0, 0}, 3.5]
        },
        Frame -> True,
        PlotRange -> {{-3, 3}, {-3, 3}},
        FrameLabel -> {"x", "y"}
    ],
    mask2D,
    Graphics[
        Text[
            Style["A", Bold, 14],
            ImageScaled[{0, 1}],
            {-1, 1}
        ]
    ],
    Background -> Red
]

Here is the desired image:

enter image description here

Notice that I have changed the background of the image to red. This can easily be modified by changing the Background property and for the mask simply change Gray to whatever color you prefer (White) for instance.

Community
  • 1
  • 1
jmlopez
  • 4,853
  • 4
  • 40
  • 74

3 Answers3

5
Plot[x^3, {x, -1, 1},
 Frame -> True,
 ImageSize -> Medium,
 FrameLabel -> {"x", "y"},
 PlotRange -> {{-1, 1}, {-1, 1}}],
 PlotRangeClipping -> False,
 Epilog ->
     Text[Style["A", Bold, 14, Red], ImageScaled@{.05, .98}]

enter image description here

Edit

Answering your orange disk part, the problem is that Show concatenates the Graphics Options, so you can't have several values for PlotRangeClipping inside a Show[ ] command. One way to overcome that is:

InsertLabels[g_Graphics, legend__] := 
  Show[Rasterize[g], 
   Graphics[{legend}, 
    Cases[AbsoluteOptions[g], Except[PlotRangeClipping -> True]]]];

g = Graphics[
   {Gray, Disk[{0, 0}, 3.5]},
   Frame -> True,
   PlotRange -> {{-3, 3}, {-3, 3}},
   FrameLabel -> {"x", "y"},
   PlotRangeClipping -> True];

Framed@InsertLabels[g,
 Text[Style["B", Red, Bold, 18], ImageScaled[{0.95, .05}]], 
 Text[Style["A", Red, Bold, 18], ImageScaled[{0.05, .95}]]]

enter image description here

Dr. belisarius
  • 60,527
  • 15
  • 115
  • 190
  • Thanks for the post. That's how much I figured from what Verbeia wrote. However, how can you make the following work? http://i.imgur.com/IL5uJ.png – jmlopez Jun 08 '11 at 19:57
  • @jmlopez Please post the code somewhere so I don't have to retype it. Gracias! – Dr. belisarius Jun 08 '11 at 20:28
  • 1
    Muchas gracias. That is exactly what I was looking for. Very sweet function you wrote there :) – jmlopez Jun 09 '11 at 01:38
  • Ouch... Belisarius, I'm sorry to bother you again but just now I noticed that you used Rasterize. This is problematic because now when I export to pdf of eps we no longer have vector graphics. Do you have a fix for this? – jmlopez Jun 09 '11 at 01:54
  • @jmlopez Perhaps using the undocumented 'XML`SVG`GraphicsToSymbolicSVG[g]' but not sure. Interesting ... – Dr. belisarius Jun 09 '11 at 02:28
  • So I found this: http://www.mathkb.com/Uwe/Forum.aspx/mathematica/20639/WebMathematica-and-SVG-graphics. It has a sample code there and from what I can tell it generates an svg version of the plot, which means that we need to have some way of accessing the XML tree to make svg edits in mathematica. Fine with me, saves me the pain of switching to inkscape and python and the fear of the fonts looking all messed up. The question now is, how do we do it? – jmlopez Jun 09 '11 at 03:05
  • @belisarius There is another way, the idea comes from @rcollyer. First `Export` the disk as a pdf, `Import` it and then `Show` it along with the labels. The only problem I'm finding is that the pdf does not preserve the `PlotRangeClipping` when it is imported into mathematica. Check out http://stackoverflow.com/questions/6301676/mathematica-rasters-in-3d-graphics to see how the Export and Import work out its magic. – jmlopez Jun 10 '11 at 08:11
  • `PlotRangeClipping -> False` fixed a problem I had with PolarPlot cutting off polar labels. – Takoda Apr 28 '21 at 08:02
3

You might have some good results using Inset with coordinates defined using ImageScaled. I'd give you exact code but I don't have a Mathematica install on my work machine.

http://reference.wolfram.com/mathematica/ref/Inset.html http://reference.wolfram.com/mathematica/ref/ImageScaled.html

See also: http://reference.wolfram.com/mathematica/ref/Scaled.html

Verbeia
  • 4,400
  • 2
  • 23
  • 44
  • Thank you Verbeia. I don't know why I never stumbled upon ImageScaled. That takes care of the absolute coordinates. However, this only works if we have set PlotRangeClipping to False. There are some cases when you want to have setPlotRangeClipping to True but still be able to put some text outside the plotting region. Something tells I will have to use Inset here but I'm still not sure how. – jmlopez Jun 08 '11 at 05:35
  • What about ImagePadding instead of PlotRangeClipping? – Verbeia Jun 08 '11 at 05:47
  • Here is an example that shows when you want PlotRangeClipping to be True. http://i.imgur.com/IL5uJ.png. Notice that the text A only appears in the Plot but not outside. – jmlopez Jun 08 '11 at 05:51
2

May be you can try Grid?

Grid[{
{
   Text[Style["A",Bold,14,Red]]
},
{
   Plot[x^3,{x,-1,1},
   Frame->True,
   ImageSize->200,
   FrameLabel->{"x","y"},
   PlotRange->{{-1,1},{-1,1}}
   ]
}},Spacings->0,Alignment->Center
]

enter image description here

Nasser
  • 12,849
  • 6
  • 52
  • 104