1

I would like your help with the route_local function of the stplanr package (https://cran.r-project.org/web/packages/stplanr/stplanr.pdf), which is on page 89.

You may realize that a map is generated from the example function, showing the path between two points (I left the code and the image generated below). I would like to do the same thing. In my case it is show the path between two points considering my roads. Both are the shapefile file. I managed to generate the roads to show (code below), but I would like to show the route between any two points from these roads. Can someone help me?? I left it at the following site https://github.com/JovaniSouza/JovaniSouza5/blob/master/Example.zip to download the shapefiles.

library(geosphere)
library(sf)
library(stplanr)

roads<-st_read("C:/Users/Jose/Downloads/Example/Roads/Roads.shp")
p <- SpatialLinesNetwork(roads, uselonglat = FALSE, tolerance = 0)
plot(p)

Map generated by code

enter image description here

Example

from <- c(-1.535181, 53.82534)
to <- c(-1.52446, 53.80949)
sln <- SpatialLinesNetwork(route_network_sf)
r <- route_local(sln, from, to)
plot(sln)
plot(r$geometry, add = TRUE, col = "red", lwd = 5)
plot(cents[c(3, 4), ], add = TRUE)
r2 <- route_local(sln = sln, cents_sf[3, ], cents_sf[4, ])
plot(r2$geometry, add = TRUE, col = "blue", lwd = 3)


enter image description here

Antonio
  • 1,091
  • 7
  • 24

1 Answers1

2

Try this. To adapt the example to your case you have to convert the coordinate system of the roads to the points shapefile (or the other way around):

library(geosphere)
library(sf)
library(stplanr)

roads <- st_read("Example/Roads/Roads.shp")
points <- st_read("Example/Points/Points.shp")

# Convert roads to coordinate system of points
roads_trf <- st_transform(roads, st_crs(points))
# Convert to points to SpatialPointsDataframe
points_sp <-  as(points, "Spatial")

from <- c(-49.95058, -24.77502) # Feature 1
to <- c(-49.91084, -24.75200) # Feature 9
p <- SpatialLinesNetwork(roads_trf, uselonglat = FALSE, tolerance = 0)
r <- route_local(p, from, to)
plot(p)
plot(r$geometry, add = TRUE, col = "red", lwd = 5)
plot(points_sp[c(3, 4), ], add = TRUE)
r2 <- route_local(sln = p, points[3, ], points[4, ])
plot(r2$geometry, add = TRUE, col = "blue", lwd = 3)
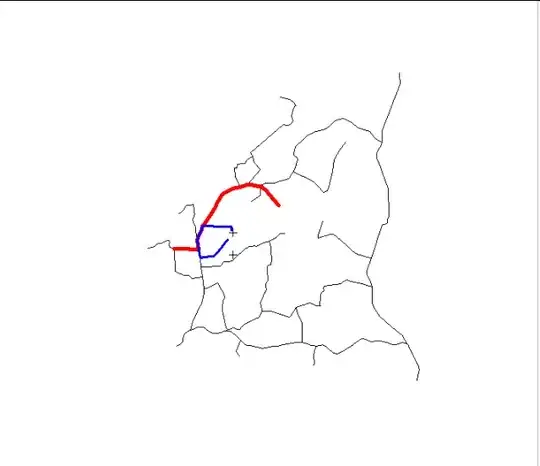
enter image description here

stefan
  • 90,330
  • 6
  • 25
  • 51
  • Thank you very much stefan, for this example, it worked correctly. However, I used very few roads. When I went to use many roads, it gave the following error: ```error: Mat::rows(): indices out of bounds or incorrectly used Error in coord_matches_sf(as.matrix(nodecoords %>% dplyr::select(.data$X, : Mat::rows(): indices out of bounds or incorrectly used``` Could you please do a test with this file with many roads? I inserted the shapefile of all roads on the website https://drive.google.com/file/d/1krpRiU2RBPWQiVz0KOaHn0JY5zCAY2eH/view?usp=sharing The file is called complete_roads. – Antonio Jul 07 '20 at 15:43
  • Hi stefan, if you can't test it, no problem. I can open a new question about this problem on the SO. Thanks again so far. – Antonio Jul 07 '20 at 20:22
  • (: Hi @Jose. After checking your data I'm afraid I can't help you on this issue. Not sure whether this is related to your data or a bug in the package. Besides asking another question on SO you could also raise an issue on the github page of the `stplanr` package. BTW: What I can tell you is that the issue also rises if one uses only a sample of your data e.g. only the first 10 or 20 rows. Therefore I would recommend to add only a sample of your data in your question. – stefan Jul 07 '20 at 20:29
  • Thanks for reply Stefan. – Antonio Jul 07 '20 at 21:24
  • Hello stefan, any idea for this question: https://stackoverflow.com/questions/63092033/issue-involving-map-generation-in-shiny – Antonio Jul 25 '20 at 18:59