For better or worse, I don't use LaTeX (yet). I like producing stargazer formatted tables on the fly for class examples in both HTML and in the console. However, I'm having trouble with 3 formatting elements; so far I've found solutions for LaTeX and some in HTML, but the ASCII console text eludes me.
The 3 challenges are:
- Breaking a line so that a variable name can wrap instead of increasing the table width.
- Aligning coefficients & std. errors at the decimal, even when there are p-value stars.
- Making space in the covariate labels & coefficients to allow for a reference group.
Let's start with some reproducible data & outputs to reference.
set.seed(3); x1 <- factor(sample(letters[1:4], 1000, replace=TRUE))
set.seed(4); x2 <- runif(1000, -10, 10)
set.seed(5); x3 <- rbinom(1000, size = 1, prob = 0.13)
set.seed(6); y <- runif(1000, -10, 10)
model <- (lm(y ~ x1 + x2 + x3))
stargazer(model, align=TRUE,
      #type="html", out="SO_stargazer.html",
      type="text", out="SO_stargazer.txt",
      title="Example Title Goes Here",
      dep.var.caption="",
      dep.var.labels="This is my long title for the Dependent Variable Y",
      covariate.labels=c("X1 Group B",
                         "X1 Group C",
                         "X1 Group D",
                         "X2 with a super ridiculous and annoyingly long name",
                         "X3"))
Line break
My default approach is to use \n in the character string. For example, I might try to break the DV caption:
dep.var.labels="This is my long title for \n the Dependent Variable Y",
But that generates the following error message:
Error in if (nchar(text.matrix[r, c]) > max.length[real.c]) { : missing value where TRUE/FALSE needed
Found a couple posts about this issue (here which reference here), but the poster on the first did not provide much of an example to follow and the second pertained to an underscore that I don't have or gave LaTeX solutions. The only difference that broke what already worked was the addition of the \n. I did try using the tex \\ escape, but that didn't do anything useful for text output.
I am able to get line breaks using <br> in the string for the html output file version.
This post also mentions the tex and html solutions, but not text.
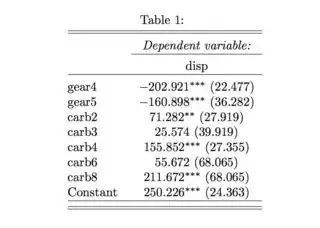
Alignment on the decimal
When there are no statistical significance stars on coefficients, both the coefficients and std. errors align nicely, centered on the decimal point. However, once the stars appear, it 'pushes' the coefficient to the left. This happens in both the text and html output. This is not so bad with 1 star, but 3 stars can be quite a difference. How can I coerce it back to align on the decimal value for both formats? This issue persists even if I use the single.row=TRUE option. This post answer by @Marco Doe has a great visual of what I'm talking about, but noted the centering is for tex. Found a LaTeX solution, but no mention of the other formats on that post. I've tinkered with the align and float options to no avail (inspired by these quasi-related tex solution posts here and here). The latter post hinted at using xtable or post-process edits, but that was more than 5 years ago; so I'm hoping for an updated viable solution.
This image is from Marco Doe's solution and shows the LaTeX output, but does a good job showing an example output formats I get (left) and what I would like to have (right).

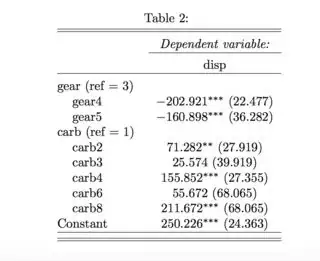
Reference categories
Found a LaTex solution, that 'pushes' the covariates & coeffient data down a row, making room for a reference group to be printed in the covariate column; however, the solution is in tex. How can I replicate this for the text output? Can I replicate it for HTML version as part of the R code without having to get surgical with the HTML output code?
@Giac posted the images (linked above) to illustrate the have (left) and want (right). Although these images are tex, how could I get the right image output in text and html?