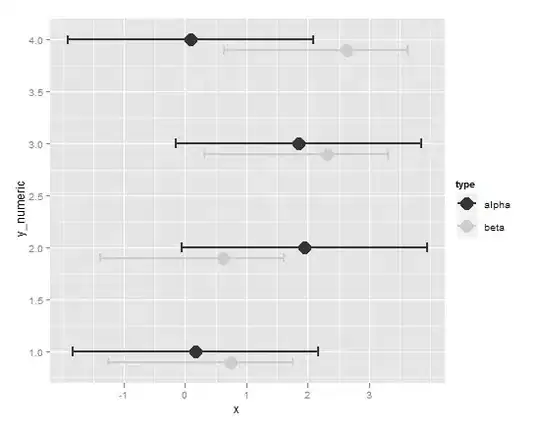
Is it possible to have 2 level x-axis label in matplotlib as shown in the image? I'm trying to show the top 3 performer for each day, so having 2 x-axis will really help to visualize.
Asked
Active
Viewed 104 times
0
-
4Does this answer your question? [pandas - multi index plotting](https://stackoverflow.com/questions/31845258/pandas-multi-index-plotting) & [How to add group labels for bar charts in matplotlib?](https://stackoverflow.com/questions/19184484/how-to-add-group-labels-for-bar-charts-in-matplotlib) – Trenton McKinney Jul 10 '20 at 07:04
-
Existing solutions using `twiny()` [docs here](https://matplotlib.org/3.1.1/api/_as_gen/matplotlib.axes.Axes.twiny.html) are for a second axis opposite from the primary. As you mention - needing to put both at the bottom, you could use `matplotlib.spine` [docs here](https://matplotlib.org/3.2.2/api/spines_api.html#module-matplotlib.spines). [This is well outlined in this solution](https://stackoverflow.com/questions/31803817/how-to-add-second-x-axis-at-the-bottom-of-the-first-one-in-matplotlib). Hope this helps. – jwho Jul 10 '20 at 07:07
-
+1 for the group labels link - thanks for sharing that. I didn't know about that feature, guessing here, but def think that gets to the intent of this question @Trenton – jwho Jul 10 '20 at 07:09
