Use ATM to extract .mat as described by Kamtal (now known Rashid).
However, note that to see the .info file in some cases, you need to click the arrow

After I pushed this forward to developers here, we got improvements in the documentation here in Section 4.
If they are all integers in the range [-2^N, 2^N-1 ] or [ 0, 2^N ], they are probably digital. Compare the values to see if they are in the expected physiological range of the signal you are analyzing. For example, if the header states that the signal is an ECG stored in milivolts, which typically has an amplitude of about 2mV, a signal of integers ranging from -32000 to 32000 probably isn't giving you the physical ECG in milivolts...
If they are not integers then they are physical. Once again you can quickly compare the values to see if they are in the expected physiological range of the signal you are analyzing.
0-9-10 wfdb - physical units
We say that signals are in 'physical units' when the values are used to represent the actual real life values as closely as possible, although obviously everything on the computer is digital and discrete rather than analogue and continuous. This includes our precious 64 bit double precision floating point values, but this is as close as we can get and already very close to the actual physical values, so we refer to them as 'physical'.
-
For example, if a 15 bit signal is collected via a capturing device, Physionet will likely store it as a 16 bit signal. Each 16 bit block stores an integer value between -2^15 and 2^15-1, and using the gain and offset stated in the header for each channel, the original physical signal can be mapped out for processing.
The default units are now physical units where base and gain should be added stated in the header for each channel, so the physical signal can be mapped out for processing.
% rawUnits
%       A 1x1 integer (default: 0). Returns tm and signal as vectors
%       according to the following values:
%               rawUnits=0 - Uses Java Native Interface to directly fetch  data, returning signal in physical units with double precision.
%               rawUnits=1 -returns tm ( millisecond precision only! ) and signal in physical units with 64 bit (double) floating point precision
%               rawUnits=2 -returns tm ( millisecond precision only! ) and signal in physical units with 32 bit (single) floating point  precision
%               rawUnits=3 -returns both tm and signal as 16 bit integers (short). Use Fs to convert tm to seconds.
%               rawUnits=4 -returns both tm and signal as 64 bit integers (long). Use Fs to convert tm to seconds.
rawUnits=1, rawUnits=2 use also physical units.
rawUnits=3, rawUnits=4 use then again analog/digital units where you need to remove base and gain.
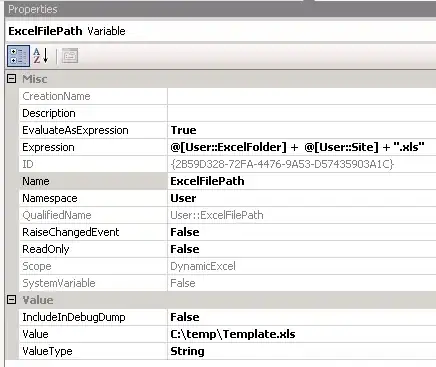
If you use rawUnits=1 or rawUnits=2, you need to adjust for base and gain where base = 1024 and gain = 200
# Kamtal's method in considering base and gain
load('201m.mat');
val = (val - 1024)/200; % you have to remove "base" and "gain"
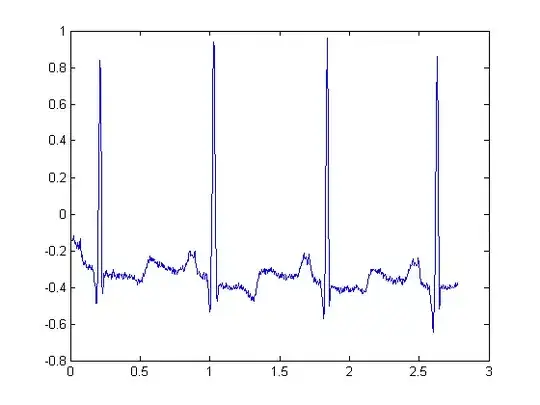
ECGsignal = val(1,16:950); % select the lead (Lead I)
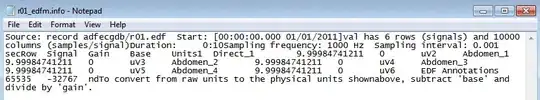
See the .info file below where you can get the base and gain. There is also the unit mV which suggests the values should be near 2 after the base-gain operations.
<0-9-9 wfdb - analog/digital units so base and gain by default; now only rawUnits=3,4 for analog units
After selection ATM, you should be able to see the list where you can select .info file after the export as described in Kamtal's answer.
The .info file instructs to remove so-called base and gain from the data before use
Source: record mitdb/201  Start: [00:02:10.000]
val has 2 rows (signals) and 3600 columns (samples/signal)
Duration:     0:10
Sampling frequency: 360 Hz  Sampling interval: 0.002777777778 sec
Row     Signal  Gain    Base    Units
1       MLII    200     1024    mV
2       V1      200     1024    mV

To convert from raw units to the physical units shown
above, subtract 'base' and divide by 'gain'.
Comparing wrong answers here! [Deprecated]
Kamtal (now called Rashid) answer is about the old wfdb system which used digital units without removal of base and gain
# Kamtal's method in considering base and gain
load('201m.mat');
val = (val - 1024)/200;    % you have to remove "base" and "gain"
ECGsignal = val(1,16:950); % select the lead (Lead I)

# Method without considering base and gain
load('201m.mat');
ECGsignal2 = val(1,16:950);

# http://www.mathworks.com/matlabcentral/fileexchange/10502-image-overlay
imshow(imoverlay(ECGsignal, ECGsignal2, uint8([255,0,0])))
and you get the difference between my method and his method