I'm trying to develop a loop to plot every column from a dataset called chr, with the code I'm using, a for loop, conditioned by some criteria, to save plots in a list
desired_length <- 8
plot_list <- vector(mode = "list", length = desired_length)
for(i in 3:10) {
  {lot_list[[i-2]] <- ggplot(chr) +
    geom_point(data = chr, aes(x = chr[,1], y = chr[,i], color = ponto),
               size = 2) +
    geom_hline(yintercept = as.double(cla[1,i-1]), size = 2, linetype = "dashed", color = "black") +
    ylim(0,max(chr[,i], na.rm = TRUE)) +
    labs(title = glue("Resultados analíticos no corpo receptor do empto para {(colnames(chr))[i]}"),
         subtitle = glue("Padrão de c3 ={cla[,i-1]} mg/L"), y = glue("{(colnames(chr))[i]} (mg/L)"), x = "Período de análise", caption = glue("Número de amostras = {sum(!is.na(chr[,i]))}")) +
    theme_minimal()
  }
}
if I save if manually, like, for example:
plot_list[[1]] <- ggplot(chr) +
  geom_point(data = chr, aes(x = chr[,1], y = chr[,3], color = ponto),
             size = 2) + ...
it plots perfectly when i run
plot_list[[1]]
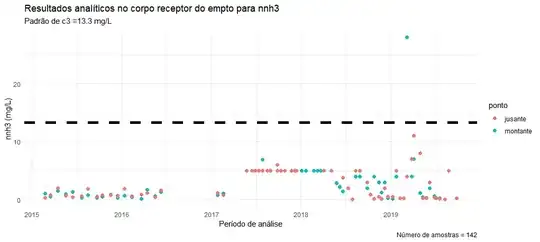
but when i run the plot after running the loop, also with plot_list[1], it displays that all values are missing and only shows this plot, with a this Warning message: Removed 142 rows containing missing values (geom_point).
What could've gone wrong? thanks in advance for helping me