-1

I am using pandas in conjunction with numpy, matplotlib, seaborne and a load of data. I am plotting dataframe data with the following line of code

####MINIMIZED CODE#####
importing numpy ect

df=pd.read_csv("csvfile")
df["movieTitle"]=pd.Categorical(df["movieTitle"] #done for "movieTitle" 
df['releaseData']=pd.to_datetime(df["releaseData"]

df2=df.sort_values('inflationGross', ascending=True) ###which was disneyData2 in original code
df2=df=df2.head(100)

plot=rando=sns.lmplot(x='releaseDate', y='inflationGross', data=df2, fit_reg=False, hue='movieTitle', legend=True)
rando.set_xticklabels(rotation=90)


########ACTUAL CODE#########

rando=sns.lmplot(x='releaseDate', y='inflationGross', data=disneyData2, fit_reg=False, hue='movieTitle', legend=True)```

The plot itself is fine, however, the categorical data, which is a series of film titles won't fit entirely on the legend. There's a large number of categories, which I understand isn't good practice but I'd like to find a way to perhaps shrink text size, or format the legend correctly. Everything has been imported correctly and I have checked there are no bugs in the code. I would like to keep only using seaborne to analyse this data NOT matplotlib Picture of the problem is included below.

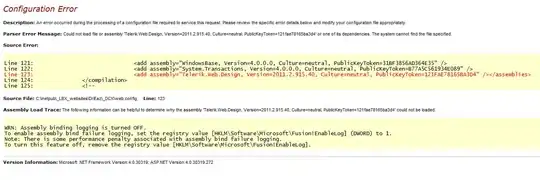
example of problem with legend

Thank you in advance for any help!

MrRaghav
  • 335
  • 3
  • 11
Georgia
  • 42
  • 6
  • Does this answer your question? [How to change legend size with matplotlib.pyplot](https://stackoverflow.com/questions/7125009/how-to-change-legend-size-with-matplotlib-pyplot) – Trenton McKinney Jul 16 '20 at 00:33
  • Would you mind explaining what I'm missing? The only other line related to this plot is: **rando.set_xticklabels(rotation=90)** or the data preprocessing which is simply declaring that column 'movieTitle' is to be taken as categorical data. I simply would like to understand how to format the legend data. – Georgia Jul 16 '20 at 00:34
  • Thank you for elaborating, I will edit this. – Georgia Jul 16 '20 at 00:37

1 Answers1

2

Roughly speaking, you can delete the automatically created legend and fetch the text of the original legend to create a new The legend will be set to (I set the font size to 8.) Since no data was presented, I modified the code on the official site for illustrative purposes. If the data is presented we will get some great answers from more people.

import seaborn as sns
import matplotlib.pyplot as plt

sns.set(color_codes=True)
tips = sns.load_dataset("tips")

g = sns.lmplot(x="total_bill", y="tip", hue='smoker', data=tips, legend=True, legend_out=True)

# Figure can hold multiple legends, so you can specify the first legend in the list
lg = g.fig.legends[0]
# Figure legend delete
g.fig.legends[0].remove()

# The list where the handle is kept
handles = lg.legendHandles
# Extracts only strings from the list of Text objects holding labels
labels = [t.get_text() for t in lg.texts]
print(handles)
print(labels)
g.fig.axes[0].legend(handles, labels, loc='center left', bbox_to_anchor=(1.0, 0.5), frameon=False, fontsize=8)

enter image description here

r-beginners
  • 31,170
  • 3
  • 14
  • 32