I need to count the number of female in each department, instead of repeating the same kind of code for each department, I want to create a loop instead: old method:
new attempt:

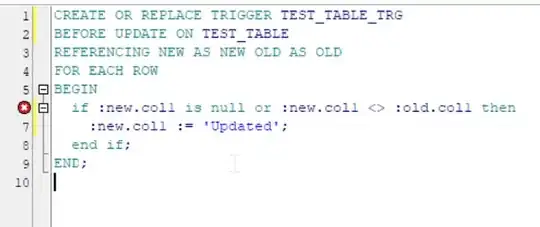
Error I got:
I am wondering where went wrong inside the for loop. Thanks for your help.