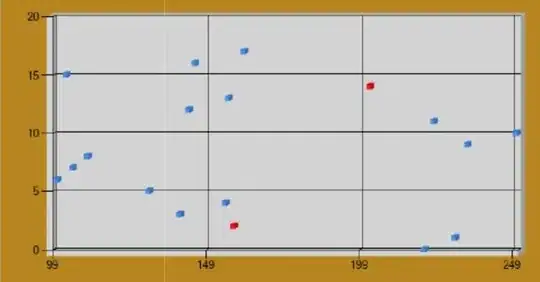
I am new to python and I am trying to create a LogLogPlot, similar to the one in the image below:
This plot, as can be seen on the top, is based on the equation y=x^2/(e^x +1).
I have found https://matplotlib.org/3.1.1/api/_as_gen/matplotlib.pyplot.loglog.html , but it doesn't;t make much sense to me.
I have also attempted the code shown in the link: pyplot: loglog() with base e and changing my expression for "y", but the axis are written in exponential form, and I was aiming to have the axis written in terms of real numbers, as shown in the image. The code looks like:
# Generate some data.
x = np.linspace(0, 10, 10)
y = x**2/(np.exp(x)+1)

plt.loglog(x,y, basex=np.e, basey=np.e)
plt.show()
But this is not giving me the same plot as the one above.

