12

While trying to optimize a code, I'm a bit puzzled by differences in profiles produced by kcachegrdind and gprof. Specifically, if I use gprof (compiling with the -pg switch, etc), I have this:

Flat profile:

Each sample counts as 0.01 seconds.
  %   cumulative   self              self     total           
 time   seconds   seconds    calls  ms/call  ms/call  name    
 89.62      3.71     3.71   204626     0.02     0.02  objR<true>::R_impl(std::vector<coords_t, std::allocator<coords_t> > const&, std::vector<unsigned long, std::allocator<unsigned long> > const&) const
  5.56      3.94     0.23 18018180     0.00     0.00  W2(coords_t const&, coords_t const&)
  3.87      4.10     0.16   200202     0.00     0.00  build_matrix(std::vector<coords_t, std::allocator<coords_t> > const&)
  0.24      4.11     0.01   400406     0.00     0.00  std::vector<double, std::allocator<double> >::vector(std::vector<double, std::allocator<double> > const&)
  0.24      4.12     0.01   100000     0.00     0.00  Wrat(std::vector<coords_t, std::allocator<coords_t> > const&, std::vector<coords_t, std::allocator<coords_t> > const&)
  0.24      4.13     0.01        9     1.11     1.11  std::vector<short, std::allocator<short> >* std::__uninitialized_copy_a<__gnu_cxx::__normal_iterator<std::vector<short, std::alloca

Which seems to suggest that I need not bother looking anywhere but ::R_impl(...)

At the same time, if I compile without the -pg switch and run valgrind --tool=callgrind ./a.out instead, I have something rather different: here's a screenshot of the kcachegrind output

enter image description here

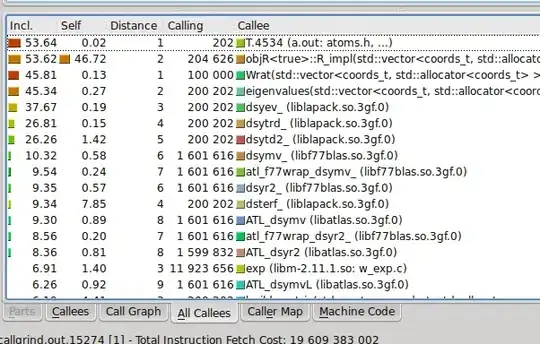
If I interpret this correctly, it seems to suggest that ::R_impl(...) only takes about 50% of time, while the other half is spent in linear algebra (Wrat(...), eigenvalues and the underlying lapack calls ) which was way down below in the gprof profile.

I understand that gprof and cachegrind use different techniques, and I'd not bother if their results were somewhat different. But here, it looks very different, and I'm at loss as to how to interpret those. Any ideas or suggestions?

ev-br
  • 24,968
  • 9
  • 65
  • 78

2 Answers2

14

You are looking at the wrong column. You have to look at the second column in kcachegrind output, the one named "self". This is the time spent by the particular subroutine only without considering its children. The first column has the cumulative time (it is equal to 100% of machine time for the main) and it is not that informative (in my opinion).

Note that from the output of kcachegrind you can see that the total time of the process is 53.64 second while the time spent in the subroutine "R_impl" is 46.72 second which is 87% of the total time. So gprof and kcachegrind agree almost perfectly.

luca
  • 156
  • 3
  • I think by default callgrind shows functions cost in machine instructions. And on screenshot we actually see relative cost in percents. So R_impl contains 46.72% of all performed instructions during profiling. – Yury Mar 15 '16 at 19:42
8

gprof is an instrumented profiler, callgrind is a sampling profiler. With an instrumented profiler you get overhead for every function entry and exit, which can skew the profile, particularly if you have relatively small functions which are called many times. Sampling profilers tend to be more accurate - they slow the overall program execution slightly, but this tends to have the same relative effect on all functions.

Try the free 30 day evaluation of Zoom from RotateRight - I suspect it will give you a profile which agrees more with callgrind than with gprof.

Paul R
  • 208,748
  • 37
  • 389
  • 560
  • so what you're saying is --- throw away the gprof's output, it's blatantly wrong, is it right? – ev-br Jun 11 '11 at 16:04
  • gprof can be useful for *some* kinds of profiling - it produces more accurate call graph information than a sampling profiler, and it may also produce reasonably accurate timing profiles for some kinds of code (e.g. when there are mainly large functions). Try another profiler such as Zoom to get a "deciding vote" as to what the real time profile looks like. – Paul R Jun 11 '11 at 16:10
  • @Zhenya: Paul's right. Try Zoom. *gprof* has [problems](http://stackoverflow.com/questions/1777556/alternatives-to-gprof/1779343#1779343). BTW gprof is a sampler, but only of the PC, and only during CPU-boundedness, so it's blind to time spent in system calls. It inserts function entry code not to measure function time, but to credit PC hits to higher level callers. Then it makes all kinds of assumptions that mess up the results. It does give you graph info, but unless your program is small (& no recursion) that doesn't tell much. – Mike Dunlavey Jun 11 '11 at 18:52
  • @Mike, @Paul: Thanks! Out of curiosity: any specific pros and/or cons for choosing between Zoom and Intel's VTune? – ev-br Jun 11 '11 at 22:36
  • @Zhenya: I haven't really used VTune but it seems to be somewhat lower level and less user friendly than Zoom. It's also x86 only whereas Zoom supports a few different CPU families. – Paul R Jun 11 '11 at 23:27
  • 2
    What?? gprof is sampling (it will sample the PC every 10 or 1 ms to get %% count in output) and cachegrind/callgrind is instrumenting (they uses valgrind to dynamically instrument code and do counting via instrumentation statistics - at basic block layer). Cachegrind/callgrind is even simulating profiler, as is measures not a real time, but a virtual events (emulated caches hierarhy, emulated branch prediction, intructions fetched w/o any stall) – osgx Aug 05 '11 at 18:20
  • @osgx: well gprof has a foot in both camps - when you compile with `gcc -pg` it causes your code to be instrumented on all function entry and exit points. callgrind can at least profile code without needing to re-compile it. I have to admit though that I don't know a lot about these open source profiling tools - the professional tools such as Zoom and Shark are so much better and I tend to use those. – Paul R Aug 05 '11 at 18:48
  • Yes, gprof needs pg. callgrind does a recompilation dynamically, and it is a recompilation (code to be executed on CPU is different from binary code). Sampling can skew the profile too (e.g. in fine-grained openmp program). – osgx Aug 05 '11 at 19:20