3

I know hjust is used for the x title axis, but how would I go about centering and multilining the x axis labels? Here is my plotting function:

gg_fun<-function(){
  ggplot(tab,                  
         aes(x = Var1, y = Percent)) +
    #theme_light() +
    theme(panel.background = element_rect(fill = NA),
          axis.title.y=element_text(angle=0, vjust=0.5, face="bold"), 
          axis.title.x=element_blank(),
          axis.text.y = element_text(size = 10), 
          axis.text.x = element_text(size = 12),
          axis.ticks.x = element_blank(),
          axis.ticks.y = element_blank(),
          #panel.grid.minor = element_line(colour = "dark gray"),
          panel.grid.major.x = element_blank() ,
          # explicitly set the horizontal lines (or they will disappear too)
          panel.grid.major.y = element_line(size=.1, color="dark gray" ),
          axis.line = element_line(size=.1, colour = "black"),
          plot.background = element_rect(colour = "black",size = 1)) +
    geom_bar(stat = "Identity", fill="#5596E6") + #"cornflower" blue
    ggtitle(element_blank()) + 
    scale_y_continuous(expand =  c(0, 0), breaks = round(seq(0, 1, by = .1), digits = 2), 
                       labels  = percent(round(seq(0, 1, by = .1), digits = 2), digits = 0),
                       limits = c(0,.6)) #+
    #scale_x_discrete()
}

Here is an example graph it produces: enter image description here
I am aware of n.dodge argument for scale_x_discrete(), but this is not what I am looking for. I also do not want to simply abbreviate using labels = abbreviate or specifying precisely as this is time consuming. I have also seen for example levels(birds$effect) <- gsub(" ", "\n", levels(birds$effect)), but this skips every line and makes some labels far too long. How would I go about centering the x label text as well as having it multiline to prevent overlap? Example of what I am going for:
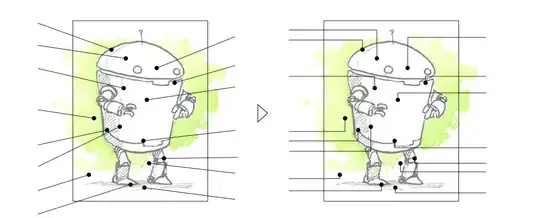
enter image description here

hkj447
  • 677
  • 7
  • 21

2 Answers2

7

You can use stringr::str_wrap as a labelling function in scale_x_discrete.

Let's take some sample data:

tab <- data.frame(Var1 = c("Video of presentation incl visuals",
                          "Video of presentation, written text and visuals",
                          "Written text, plus visuals",
                          "Other (please specify)"),
                 Percent = c(0.33, 0.34, 0.16, 0.17))

With your original function, this gives the following plot:

gg_fun()

enter image description here

But with the following modification:

gg_fun<-function(){
  ggplot(tab,                  
         aes(x = Var1, y = Percent)) +
    #theme_light() +
    theme(panel.background = element_rect(fill = NA),
          axis.title.y=element_text(angle=0, vjust=0.5, face="bold"), 
          axis.title.x=element_blank(),
          axis.text.y = element_text(size = 10), 
          axis.text.x = element_text(size = 12),
          axis.ticks.x = element_blank(),
          axis.ticks.y = element_blank(),
          #panel.grid.minor = element_line(colour = "dark gray"),
          panel.grid.major.x = element_blank() ,
          # explicitly set the horizontal lines (or they will disappear too)
          panel.grid.major.y = element_line(size=.1, color="dark gray" ),
          axis.line = element_line(size=.1, colour = "black"),
          plot.background = element_rect(colour = "black",size = 1)) +
    geom_bar(stat = "Identity", fill="#5596E6") + #"cornflower" blue
    ggtitle(element_blank()) + 
    scale_y_continuous(expand =  c(0, 0), 
                       breaks = round(seq(0, 1, by = .1), digits = 2), 
                       labels  = scales::percent(round(seq(0, 1, by = .1), 
                                                       digits = 2), digits = 0),
                       limits = c(0,.6)) +
    scale_x_discrete(labels = function(x) stringr::str_wrap(x, width = 16))
}

We get:

gg_fun()

enter image description here

Allan Cameron
  • 147,086
  • 7
  • 49
  • 87
0

Typically, you have to manually place the newline character '\n' within your labels. However, someone wrote a function to do this automatically, which is provided in this thread.