21

I am looking for a library to generate svg diagrams in python (I fetch data from a sql database). I have found python-gd, but it has not much documentation and last update was in 2005 so I wonder if there are any other libraries that are good for this purpose.

I am mostly thinking about simple line graphs, something like this:
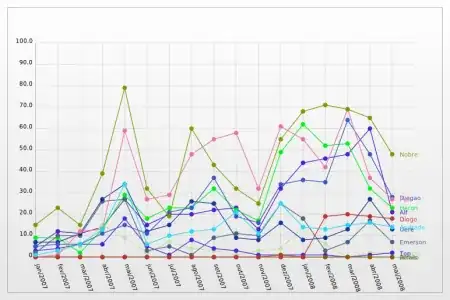
 example line graph

Community
  • 1
  • 1
Zitrax
  • 19,036
  • 20
  • 88
  • 110

11 Answers11

11

Try using matplotlib. You can configure it with a SVG backend.

zweiterlinde
  • 14,557
  • 2
  • 27
  • 32
  • 4
    Although I've used this, and it works, I've always found matplotlib pretty clunky to work with. I prefer nearly any other graphing library over matplotlib. – Cerin Aug 22 '10 at 16:58
9

PyChart "is a Python library for creating high quality Encapsulated Postscript, PDF, PNG, or SVG charts."

0 _
  • 10,524
  • 11
  • 77
  • 109
vartec
  • 131,205
  • 36
  • 218
  • 244
  • 2
    I can just mention that after I used CairoPlot for a while I switched to PyChart which is much more configurable. – Zitrax Apr 20 '09 at 19:48
9

pyCairo is an option worth looking at.

Ignacio Vazquez-Abrams
  • 776,304
  • 153
  • 1,341
  • 1,358
  • 1
    Not only can pycairo write to SVG. With a few lines of code changed, it can write the same data to either a PDF or a PNG. Very flexible. – pi. Mar 11 '09 at 19:40
9

As you're looking for simple line graphics, probably, CairoPlot will fit your needs as it can generate svg output files out of the box. Take a look at this.

CairoPlot - DotLinePlot

This example image shows only a few of its capabilities. Using the trunk version available at launchpad you'll be able to add a legend box and add axis titles.

Besides that, using the trunk version, it's possible to generate:

  • DotLine charts (the ones I believe you need)
  • Scatter charts
  • Pie/Donut charts
  • Horizontal/Vertical Bar charts
  • Gantt charts
Community
  • 1
  • 1
Rodrigo
  • 5,938
  • 6
  • 31
  • 39
  • I ended up using this as I do not do anything more advanced. However I never managed to find how to get those small legends printed to the right, neither from trunk or in 1.1, you can get legends in a box though. – Zitrax Mar 12 '09 at 17:22
  • Yeah, the little legends on the right were removed on newer versions as they didn't work well for many values (as you can see above). The only option, nowadays, is to use the box on the right upper corner (available only on trunk version). – Rodrigo Mar 12 '09 at 17:31
  • Unfortunately, the last commit to CairoPlot seems to have been in 2010. – Dave Land May 23 '19 at 16:07
7

Here's a general purpose SVG library in Python: pySVG.

Hank Gay
  • 70,339
  • 36
  • 160
  • 222
7

You can use Graphviz to generate diagrams in SVG format. There are Python bindings to Graphviz e.g., pydot -- Python interface to Graphviz's Dot language.

jfs
  • 399,953
  • 195
  • 994
  • 1,670
  • 1
    While Graphviz is great, it is neither a general SVG solution nor does it address the specific requirement specified in the question. This answer seems like a non sequitur. – Laurence Gonsalves Jun 07 '09 at 13:02
  • @Laurence Gonsalves: Line plots are not the only type of diagrams http://images.google.com/images?q=diagram – jfs Jun 07 '09 at 18:50
  • The question specifically asked for "simple line graphs" and had an example that made it pretty clear to anyone that both read the question and has used Graphviz that Graphviz wouldn't be helpful to them. Like I said: Graphviz is great. I use it all the time. Recommending it here is like recommending a screwdriver to someone that wants to drive in nails, however. – Laurence Gonsalves Jun 07 '09 at 19:28
  • 4
    @Laurence Gonsalves: People searching for "python svg diagrams" might not care about "simple line plots" http://www.google.com/search?hl=en&q=python+svg+diagrams 1. see the first version of the question 2. most visitors of stackoverflow.com are from google. – jfs Jun 07 '09 at 19:56
  • Case in point, I was looking for a way to generate graphs like what graphviz makes using Python, and I searched on Google and found this post. It seems to be exactly what I need, so thanks! – Ibrahim Dec 28 '09 at 08:06
4

Consider svgwrite https://pypi.org/project/svgwrite, a Python package to create SVG drawings.

0 _
  • 10,524
  • 11
  • 77
  • 109
Matthew Chen
  • 209
  • 3
  • 9
3

svgfig is worth a look:

http://code.google.com/p/svgfig/

Andrew Wagner
  • 22,677
  • 21
  • 86
  • 100
1

Being not exactly related to SVG plots, but searching for the same thing I have found a good source of carefully collected useful info to answer your question: http://wiki.python.org/moin/NumericAndScientific/Plotting

vasq
  • 51
  • 1
  • 5
0

2018 Update:

Plotly ( https://github.com/plotly/plotly.py / https://plot.ly/d3-js-for-python-and-pandas-charts/ ) is probably the most versatile solution. It is distributed under MIT license (free to use and reuse), although it include features that might not be compatible with some CMS with more restrictive security issues since it relies on JS, although options to export the diagrams as plain SVG are also available.

Pygal ( https://github.com/Kozea/pygal / http://pygal.org ) is simpler relies only on svg standard. As such it's results are more reusable under more restrict CMS systems. It is distributed under GNU license.

Fábio Lobão
  • 171
  • 1
  • 11
  • This is probably a good answer to the question. Nevertheless, I've flagged question, because it's off topic to find resources. – colidyre Nov 15 '18 at 10:47
0

I have tried to collate a list of available charting libraries(its an ongoing work, wherein i keep updating the list) : http://blizzardzblogs.blogspot.com/2010/12/data-visualization-charts-and.html

I feel that protovis would do the job for you. Its

  • light weight,
  • generates svg (which can be exported easily) and
  • is javascript

So nothing more to learn :)

sprezzatura
  • 472
  • 5
  • 17