2

I have some GPS data with a value assigned to each point (think like air quality). I can plot those points, with folium for instance, and map the value to the size of a circle, like this:

import pandas, numpy, folium
lat = numpy.random.uniform(45, 45.01, 250)
lon = numpy.random.uniform(3, 3.02, 250)
value = numpy.random.uniform(0,50,250)
df = pandas.DataFrame({'lat': lat, 'lon': lon, 'value': value})
mymap = folium.Map(location = [lat.mean(), lon.mean()], tiles="OpenStreetMap", zoom_start=14)
for elt in list(zip(df.lat, df.lon, df.value)):
    folium.Circle(elt[:2], color="blue", radius=elt[2]).add_to(mymap)
mymap.save('mymap.html')

enter image description here

And I would like to treat this data, interpolate it and create a shapefile as the output, with interpolated polygons containing the average value and showing areas of high and low value (fake picture on the right). The limit of the polygons would auto-generated, of course, from the interpolation.

How can I achieve this? Because i have tried using HeatMap tool in folium, but it is designed to interpolate the density of points, not the value associated with each point! I hope it's not too complex..Thanks, note: I use folium but i'm ok with other python libraries.

agenis
  • 8,069
  • 5
  • 53
  • 102
  • Is there a temporal dimension in addition with spatial? Does the map need to be dynamic such as folium map? – jlandercy Aug 30 '20 at 21:05
  • @jlandercy well, not in my use case. But if it comes for free .. .:-) – agenis Aug 31 '20 at 07:56
  • Notice there is also [`HeatMapWithTime`](https://python-visualization.github.io/folium/plugins.html#folium.plugins.HeatMapWithTime) object in `folium`. – jlandercy Aug 31 '20 at 09:27

2 Answers2

5

We can feed the values to HeatMap in folium as weights (see the data parameter in documentation).

Here's an example. I've divided values in the bottom half of the box by 5 to demonstrate that despite the relatively uniform density of data points, the heat map clearly shows higher magnitudes in the upper half of the picture:

import pandas as pd
import numpy as np
import folium
from folium.plugins import HeatMap
import matplotlib as mpl

# parameters
n = 250                     # number of points
lat0 = 40.7                 # coordinates will be generated uniformly with
lon0 = -73.9                # lat0 - eps <= lat < lat0 + eps
eps = 0.1                   # lon0 - eps <= lon < lon0 + eps
v_min, v_max = 0, 100       # min, max values

# generating values
lat = np.random.uniform(lat0 - eps, lat0 + eps, n)
lon = np.random.uniform(lon0 - eps, lon0 + eps, n)
value = numpy.random.uniform(v_min, v_max, n)
df = pandas.DataFrame({'lat': lat, 'lon': lon, 'value': value})

# to demonstrate the effect of weights on the heatmap,
# we'll divide values below the center of the box by K = 5
K = 5
df.loc[df['lat'] < lat0, 'value'] /= K

# plotting the map, both the points themselves and the heatmap
m = folium.Map(location = [lat0, lon0], tiles="OpenStreetMap",
               zoom_start=11, width=400, height=400)
for elt in list(zip(df.lat, df.lon, df.value)):
    folium.Circle(elt[:2], color="white", radius=elt[2]).add_to(m)

# df.values used here is a (250, 3) numpy.ndarray
# with (lat, lon, weight) for each data point
HeatMap(data=df.values, min_opacity=0.1).add_to(m)

m

Output:

heatmap


Update:

Here's a slightly different approach, not using the built-in HeatMaps (which is probably currently a better option in light of https://github.com/python-visualization/folium/issues/1271, as mentioned by @agenis).

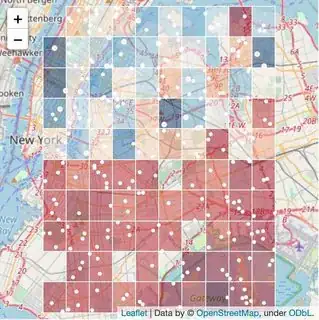
We first transform our data, making the grid of squares, where value for each square is the average of original data point values lying within that cell (so it does not depend on the number of points within that cell, only their values).

Then we can visualise those squares by plotting GeoJson polygons on the map. Here's an example:

# define the size of the square
step = 0.02

# calculate values for the grid
x = df.copy()
x['lat'] = np.floor(x['lat'] / step) * step
x['lon'] = np.floor(x['lon'] / step) * step
x = x.groupby(['lat', 'lon'])['value'].mean()
x /= x.max()
x = x.reset_index()

# geo_json returns a single square
def geo_json(lat, lon, value, step):
    cmap = mpl.cm.RdBu
    return {
      "type": "FeatureCollection",
      "features": [
        {
          "type": "Feature",
          "properties": {
            'color': 'white',
            'weight': 1,
            'fillColor': mpl.colors.to_hex(cmap(value)),
            'fillOpacity': 0.5,
          },
          "geometry": {
            "type": "Polygon",
            "coordinates": [[
                [lon, lat],
                [lon, lat + step],
                [lon + step, lat + step],
                [lon + step, lat],
                [lon, lat],
              ]]}}]}


# generating a map...
m = folium.Map(location=[lat0, lon0], zoom_start=11, width=400, height=400)

# ...with squares...
for _, xi in x.iterrows():
    folium.GeoJson(geo_json(xi['lat'], xi['lon'], xi['value'], step),
                   lambda x: x['properties']).add_to(m)

# ...and the original points
for elt in list(zip(df.lat, df.lon, df.value)):
    folium.Circle(elt[:2], color="white", radius=elt[2]).add_to(m)

m

Output:

grid


Update (2):

Here's a version with interpolation on the grid using griddata:

import pandas as pd
import numpy as np
import folium
from scipy.interpolate import griddata

# parameters
n = 250                     # number of points
lat0 = 40.7
lon0 = -73.9
eps = 0.1
v_min, v_max = 0, 100       # min, max values

# generating values
lat = np.random.normal(lat0, eps, n)
lon = np.random.normal(lon0, eps, n)
value = numpy.random.uniform(v_min, v_max, n)

# set up the grid
step = 0.02
xi, yi = np.meshgrid(
    np.arange(lat.min() - step/2, lat.max() + step/2, step),
    np.arange(lon.min() - step/2, lon.max() + step/2, step),
)

# interpolate and normalize values
zi = griddata((lat, lon), value, (xi, yi), method='linear')
zi /= np.nanmax(zi)
g = np.stack([
    xi.flatten(),
    yi.flatten(),
    zi.flatten(),
], axis=1)

# geo_json returns a single square
def geo_json(lat, lon, value, step):
    cmap = mpl.cm.RdBu
    return {
      "type": "FeatureCollection",
      "features": [
        {
          "type": "Feature",
          "properties": {
            'color': 'white',
            'weight': 1,
            'fillColor': mpl.colors.to_hex(cmap(value)),
            'fillOpacity': 0.5,
          },
          "geometry": {
            "type": "Polygon",
            "coordinates": [[
                [lon - step/2, lat - step/2],
                [lon - step/2, lat + step/2],
                [lon + step/2, lat + step/2],
                [lon + step/2, lat - step/2],
                [lon - step/2, lat - step/2],
              ]]}}]}


# generating a map...
m = folium.Map(location=[lat0, lon0], zoom_start=9, width=400, height=400)

# ...with squares...
for gi in g:
    if ~np.isnan(gi[2]):
        folium.GeoJson(geo_json(gi[0], gi[1], gi[2], step),
                       lambda x: x['properties']).add_to(m)

# ...and the original points
for elt in list(zip(lat, lon, value)):
    folium.Circle(elt[:2], color='white', radius=elt[2]).add_to(m)

m

Output:

grid_interpolated

perl
  • 9,826
  • 1
  • 10
  • 22
  • thanks, that's an good contribution. However I've read stuff about the weight parameter, it says that the result will always be a combination of point density and weight. IS it possible to completely remove the effect of point density in your heatmap? I guess the algorithm aggregates the weights, so more points means more weight, no matter the value of the point. – agenis Aug 31 '20 at 08:00
  • 1
    @agenis Could you post the reference you have read. HeatMap generaly sums weights over the area it renders. If you do not normalize with point density you will not converge towards means, so density is what you are looking for. It is also common to divide by the surface area of the region points stands for. The choice between those normalizations essentially depends on the nature of your variable. For concentration it is usually just normalized by the density of points to converge to means. – jlandercy Aug 31 '20 at 09:35
  • 1
    I read two theads. This first on a bug with heatmap weights but aparently it's closed https://github.com/python-visualization/folium/issues/1271 a second on the problem we are discussing: https://github.com/python-visualization/folium/issues/902 – agenis Aug 31 '20 at 12:12
  • 1
    @agenis Yes, that's a good point, I also found those (after posting the original solution). I've made an update with an alternative approach. We first transform our data by taking the average of our original values on a grid, so we no longer depend on point concentration. However, there's still that problem with their implementation of HeatMap itself, so I moved to constructing square cells with GeoJSON polygons instead. A bit more involved, but definitely more robust – perl Aug 31 '20 at 12:22
  • I like this new approach with the geojson grid. Still, i can't have empty squares, so i was thinking instead of taking the mean of value, what about training a KNN or SVN regressor to predict the mean value of any square (even if no points were sampled here)? Of course, it would generate a rectangular bounding box for the whole region, but maybe we could intersect it with the convex hull suggested in other answer. – agenis Sep 01 '20 at 14:04
  • 1
    Maybe we can simplify that and use [`griddata`](https://docs.scipy.org/doc/scipy/reference/generated/scipy.interpolate.griddata.html) to interpolate values in cells where we don't have any datapoints? I've posted an example above (in "Update (2)") – perl Sep 01 '20 at 15:16
  • thanks that's great. juste one more question, do you happen to have an easy way to export this grid into a shapefile (shp, shx)? – agenis Sep 03 '20 at 10:37
  • Never done it myself, but looks like it should not be too difficult to convert GeoJson to SHP (e.g. https://stackoverflow.com/questions/44049679/geojson-to-shapefile-using-python). We would need to combine the individual GeoJson squares from `geo_json(gi[0], gi[1], gi[2], step)` to a single GeoJson, but that should also be relatively straightforward (e.g. with appending GeoJson features from the `for gi in g` loop). Let me know if you need any help with that – perl Sep 03 '20 at 12:12
0

I appears to me that you need to filter your data so you split it into groups according to given categories. With those sets of points, you should then be able to generate convex hulls. It appears there are methods to do this in scipy - see here for some examples: Convex hull area in Python?

Den-Jason
  • 2,395
  • 1
  • 22
  • 17
  • thanks, but i guess this would end up with a set of polygons (hulls) that would not be contiguous, there would be some gaps and some overlap between them (with unknow value). – agenis Sep 01 '20 at 14:02
  • Indeed; it's not too difficult to shrink/expand them in order to snap together. I used to manually do this with my old implementations since I had a similar requirement to yours (no overlaps nor gaps). I'm sure someone out there has written something to fix the imperfections. – Den-Jason Sep 01 '20 at 16:29
  • Basically, you're looking for a "polygon snap" or "convert polygons to mesh" algorithm. There's another SO question on this basis here: https://stackoverflow.com/questions/7495487/convert-polygons-into-mesh . . There's another question about making a polygon from cellular rectangles - there are spatial-union algorithms available to do that. See here: https://stackoverflow.com/questions/643995/algorithm-to-merge-adjacent-rectangles-into-polygon – Den-Jason Sep 01 '20 at 16:35