I want to animate some data as a black line that is circumscribed by two static red lines. The static lines are UP and DOWN. My animated data is in y and the timeline is x.
I tried a lot - with transition_components() and transition_layers() - but nothing worked... but perhaps I had some failures in my code I'm not sure... How to assign color to lines I found Changing line colors with ggplot() but my handling isn't proper...
My gganimate code that has to be completed:
# load the needed packages
library(gifski)
library(ggplot2)
library(gganimate)
theme_set(theme_bw())

# add the time vector x
### 10.1 seconds with timestep 0.1 seconds
x=rep(seq(from=0,to=10,by=0.1),times=3)

# y should be the line in the plot which should be animated
y=c(seq(from=0,to=10,length.out=which(round(x,1)==2)[1]),rep(10,times=which(round(x,1)==5)[1]-which(round(x,1)==2)[1]),10*0.95^(seq(from=1,by=1,length.out=50)))

# UP and DOWN should be static lines in the animated plot
### there shouldn't be a "linemoving" from left to rigth side of the plot
UP=c(seq(from=1,to=12,length.out=which(round(x,1)==1.8)[1]),
    rep(12,times=which(round(x,1)==5.5)[1]-which(round(x,1)==1.8)[1]),
    seq(from=12,to=4,length.out=length(seq(from=0,to=10,by=0.1))-which(round(x,1)==1.8)[1]-(which(round(x,1)==5.5)[1]-which(round(x,1)==1.8)[1]))
    )
DOWN=c(seq(from=0,to=8,length.out=which(round(x,1)==2.2)[1]),
    rep(8,times=which(round(x,1)==4.5)[1]-which(round(x,1)==2.2)[1]),
    seq(from=8,to=1,length.out=length(seq(from=0,to=10,by=0.1))-which(round(x,1)==2.2)[1]-(which(round(x,1)==4.5)[1]-which(round(x,1)==2.2)[1]))
    )


value=c(y,UP,DOWN)
h=length(seq(from=0,to=10,by=0.1))
variable=c(rep("y", h), rep("UP", h), rep("DOWN", h) )

# the dataframe with the three columns
df=data.frame(x, variable, value)

p=ggplot(df, aes(x=x, y=value, group=variable, colour=variable ) ) + geom_line(size=2) + scale_color_manual(values=c("black", "red", "red")) # I want that y is a black line and UP and DOWN are red lines

# x is my time variable in the dataframe
p2=p + transition_reveal(x)

# animating p2
animate(p2)
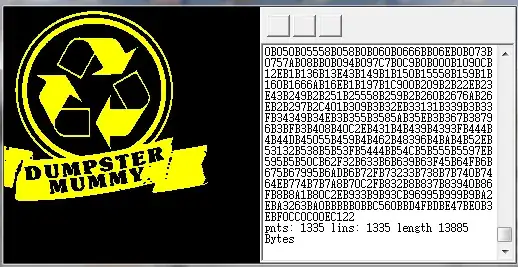
The finished plot should look like this picture
To me here are arising some questions:
- How can I achieve that only my black line (y vector) is animated and the two black lines (UP and Down) remain static
- Assigning the color to the lines in a proper way
- Where is my gif saved
- Is it needed that all my lines are defined from the beginning of the timeline x? Or is it possible to start the UP vector at x[10]=0.9 seconds.
