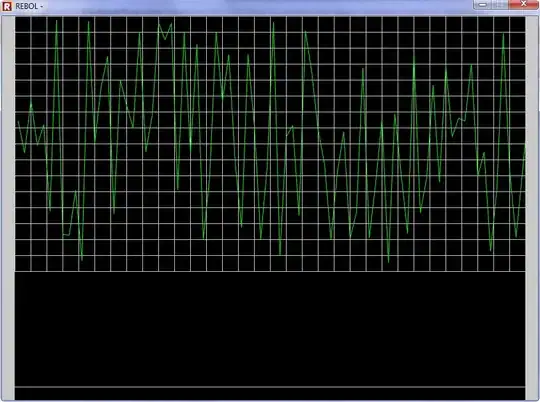
I want to plot regression lines in R for technical analysis.
First, I regress the price on the date and I get the main regression line. However, also, I need lines that correspond to (Main regression line +- 2*standard deviation).
Do you know how I can implement this? I already checked the TTR package, but I couldn't find a built-in indicator for this purpose.
Thank you.
